
Overview
Introducing GPU servers into existing data centers to accommodate growing AI workloads requires a review of cooling operation alongside IT equipment expansion and relocation. Changes in rack heat loads and airflow requirements affect room airflow and the distribution of cooling loads. Thermal conditions therefore need to be evaluated during both normal operation and the transient response to cooling equipment failure.
This case concerns an existing server room in Seoul, South Korea, reconfigured for AI workloads. Boreas was used to analyze airflow and heat transfer throughout the server room, compare CRAH (computer room air handler) operating and standby configurations, and assess cooling headroom following a single-unit failure. CRAH airflow and cooling loads are reported as percentages of rated values.
The reconfigured room has an IT heat load of approximately 0.33 MW across 22 active racks, with individual rack loads of 4–28 kW. Rack exhaust returns to wall-mounted CRAHs through hot-aisle containment and a ceiling plenum. Two configurations, each combining duty units with one hot-standby unit, were compared in terms of rack inlet temperature, CRAH cooling load, airflow, and fan operating range during normal operation and an emergency shutdown of one CRAH.
| Configuration | Operating units | After failure |
|---|---|---|
| A | 2 duty + 1 hot standby = 3 | 2 |
| B | 3 duty + 1 hot standby = 4 | 3 |
Six CRAHs are installed. Units outside the operating configuration were modeled in cold standby, stopped with closed dampers. To account for unequal loads caused by differences in return-air temperature, capacity was assessed using the most heavily loaded unit and the following criteria:
- CRAH cooling load and airflow remain within rated values.
- Rack inlet temperature remains at or below 27 °C, the ASHRAE recommended upper limit; the A1 allowable upper limit of 32 °C is treated as an absolute ceiling for this assessment.
- After failure, the remaining CRAHs deliver the target airflow within a fan speed range of 30–100%.
Both configurations met the assessment criteria under the modeled conditions. Failure reduced cooling headroom in both configurations relative to normal operation. The remaining headroom after failure was approximately 29 percentage points for A and 50 percentage points for B. This difference provides a basis for selecting the number of operating units and the desired failure contingency margin.
Computational model
The server room measures 43 m × 22 m × 6.7 m, including the ceiling plenum. It contains two hot aisles, HA-01 and HA-02, each with 14 rack positions, and six CRAHs along one wall. The model was developed from customer-supplied layouts, equipment specifications, and maximum airflow and heat-load data for each rack.
| Item | Setting |
|---|---|
| Domain | 43 × 22 × 6.7 m, including ceiling plenum |
| Mesh | 0.2 m base size; 0.15 m refinement around racks; 3.52 million cells, including 2.78 million fluid cells |
| Racks | Porous media, fan curves, and heat sources using maximum airflow and heat load for each rack; 22 active and 6 unpowered racks |
| Containment | Hot-aisle end doors and overhead panels represented by zero-thickness internal walls; exhaust enters the plenum through ceiling openings |
| CRAHs | Supply air set to 24 °C; two operating models described below; stopped units represented as walls |
| Columns, partitions, ceiling beams, and piping equipment | More than 100 solid objects converted from STEP geometry |
| Turbulence and advection | Chen zero-equation model, first-order upwind, buoyancy enabled |
| Time | dt = 1 s over 1,000 s; rack heat load ramped over the first 30 s; steady results averaged over 900–1,000 s |
| Solver and hardware | Boreas v0.10 series, GPU mixed precision; one NVIDIA RTX A2000 12 GB GPU |
Method: two CRAH representations
Because CRAHs are controlled by a building management system (BMS), two representations were evaluated to check whether both met the criteria under different control assumptions.
| Item | Pressure-boundary approach | Fan-boundary approach: airflow control and fan curve |
|---|---|---|
| CRAH model | Supply-face total pressure 0 Pa; return-face static pressure −2 Pa. CRAH airflow is an output | crac equipment model; required fan speed calculated each step from the fan curve for a target airflow shared among operating units; cooling capacity limited |
| Purpose | Airflow and load distribution determined by room resistance and rack fans without airflow control, used as an upper-bound estimate of load concentration | Operating points and failure transients with uniform-airflow BMS control |
| Failure | Steady calculation with the failed CRAH replaced by a wall | Power loss at 600 s; 10 s fan coastdown with zero cooling; remaining units ramp up over 610–640 s |
| Cases | 4: normal and failure conditions for A and B | 4: the same configurations |
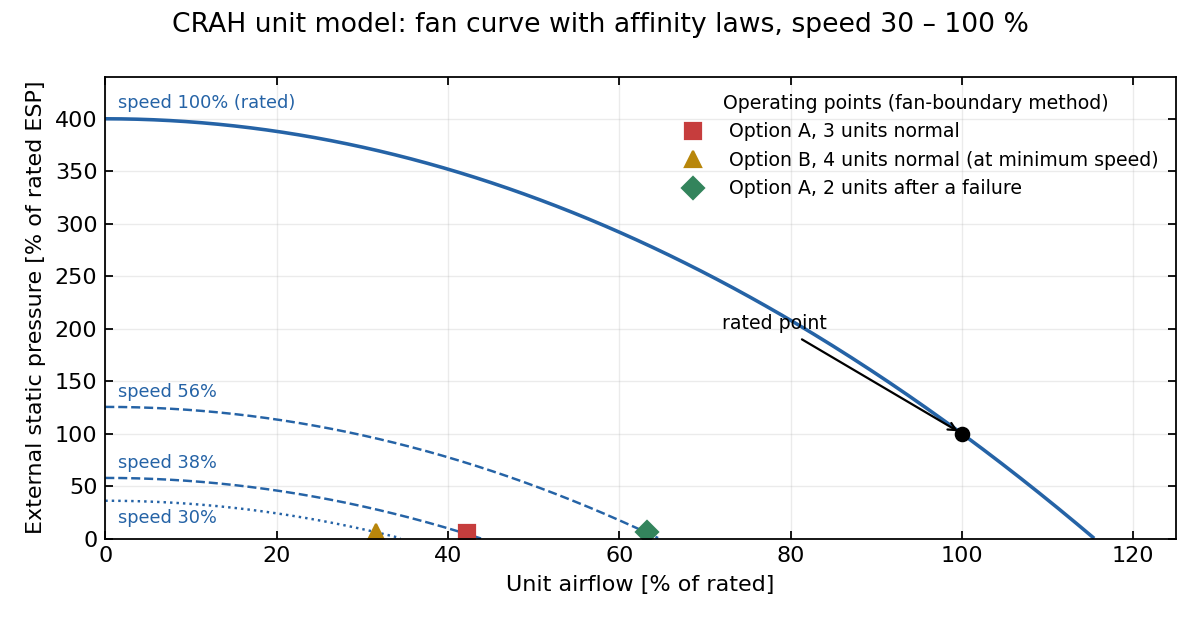
Fan curves for the fan-boundary approach. Affinity laws generate curves for 30–100% speed from a curve passing through the rated point. Required speed is calculated each step from target airflow and external static pressure. Three operating points are shown. Configuration B with four operating units is constrained by the 30% minimum speed.
The maximum load ratios from the two approaches were close: 69.6% versus 71.2% after failure in A, and 48.2% versus 48.9% during normal operation. The assessment below uses the larger value from the two approaches.
Result 1: temperature field during normal operation
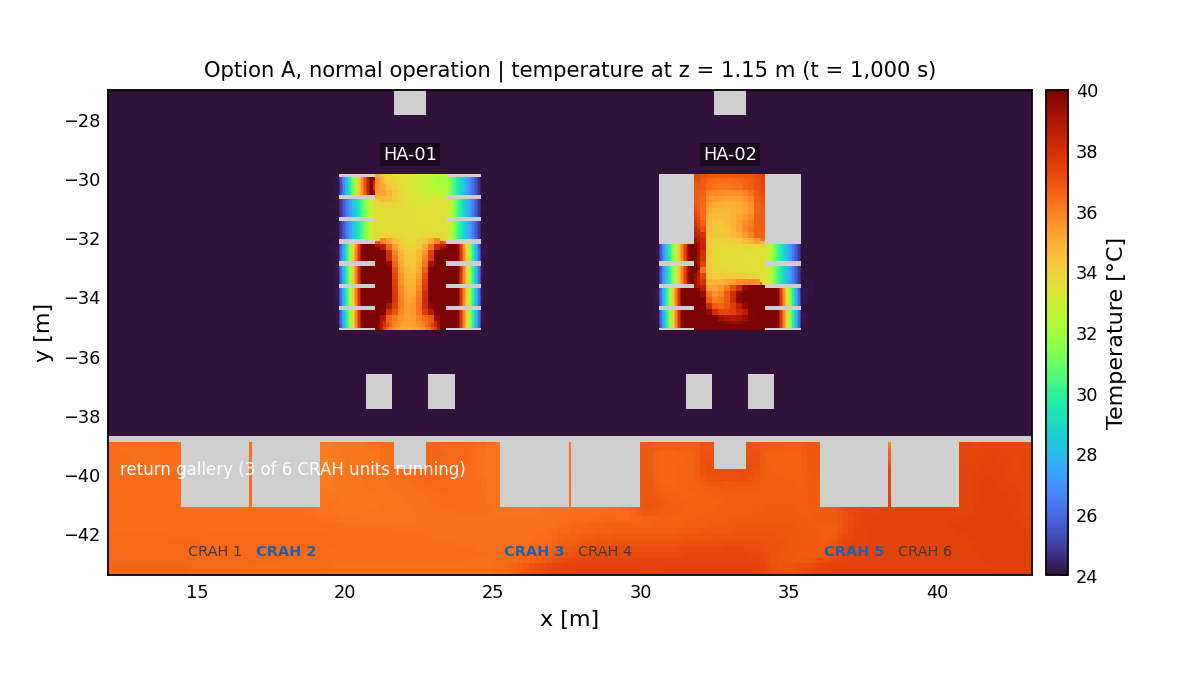
Configuration A during normal operation, at z = 1.15 m, approximately rack mid-height. The cold region remains near the 24 °C supply temperature; the two hot aisles are at 34–40 °C. The lower strip is the return gallery behind the CRAHs, carrying 36–37 °C air from the ceiling plenum. Bold labels indicate operating CRAHs.
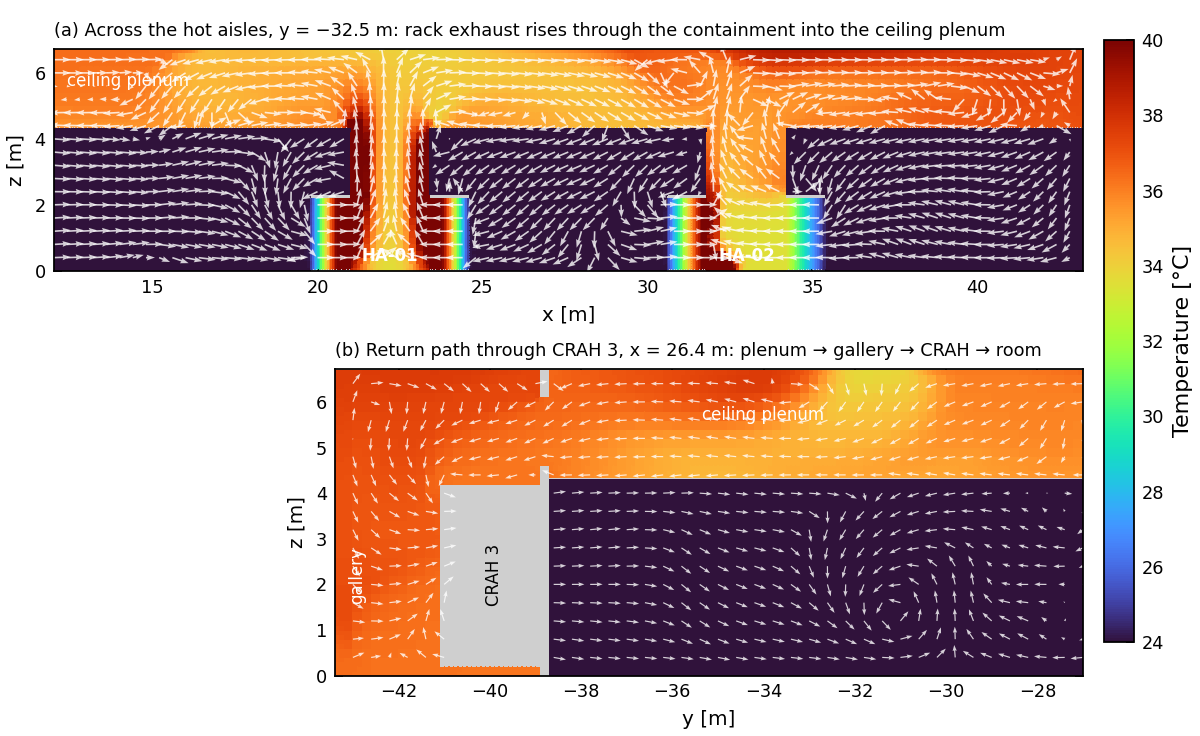
(a) Cross-section through both hot aisles: rack exhaust rises within the containment and enters the plenum through ceiling openings. (b) Longitudinal section through CRAH 3: air circulates from the plenum through the gallery and CRAH back into the room. Arrows indicate direction only and have equal lengths.
The maximum inlet temperature across the 22 active racks was 24.2 °C, 0.2 K above supply temperature. No rack exceeded 27 °C in either configuration. The difference between total CRAH cooling and rack heat generation was within 1%.
Result 2: CRAH load headroom by configuration
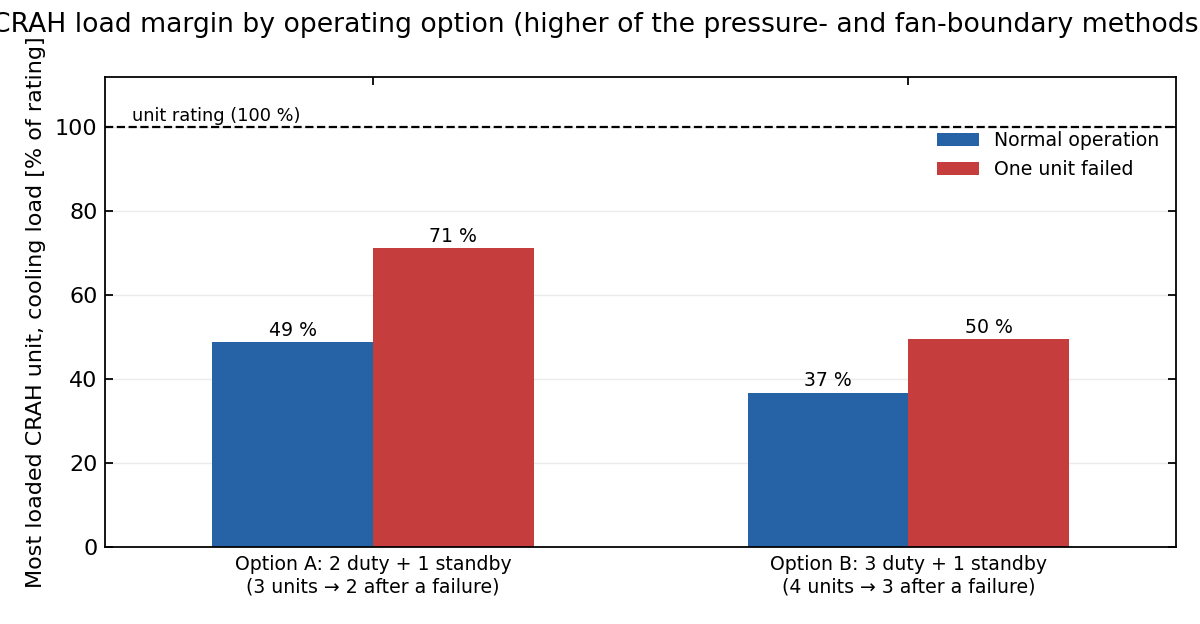
Cooling load of the most heavily loaded CRAH, with rated capacity equal to 100%. Values are the larger of the two modeling approaches for normal operation and a single-unit failure.
| Configuration | Operating units, normal → failure | Maximum normal load | Maximum post-failure load | Maximum post-failure airflow | Maximum rack inlet temperature, normal → post-failure | Assessment |
|---|---|---|---|---|---|---|
| A (2+1) | 3 → 2 | 49% | 71% | 65% | 24.2 → 24.3 °C | Meets criteria; 29 percentage points of headroom |
| B (3+1) | 4 → 3 | 37% | 50% | 47% | 24.2 → 24.3 °C | Meets criteria; 50 percentage points of headroom |
Configuration A met the criteria. Compared with A under the same failure condition, B retained approximately 20 percentage points more headroom and also reduced normal operating load. Airflow remained at or below 65% of rated flow in all cases.
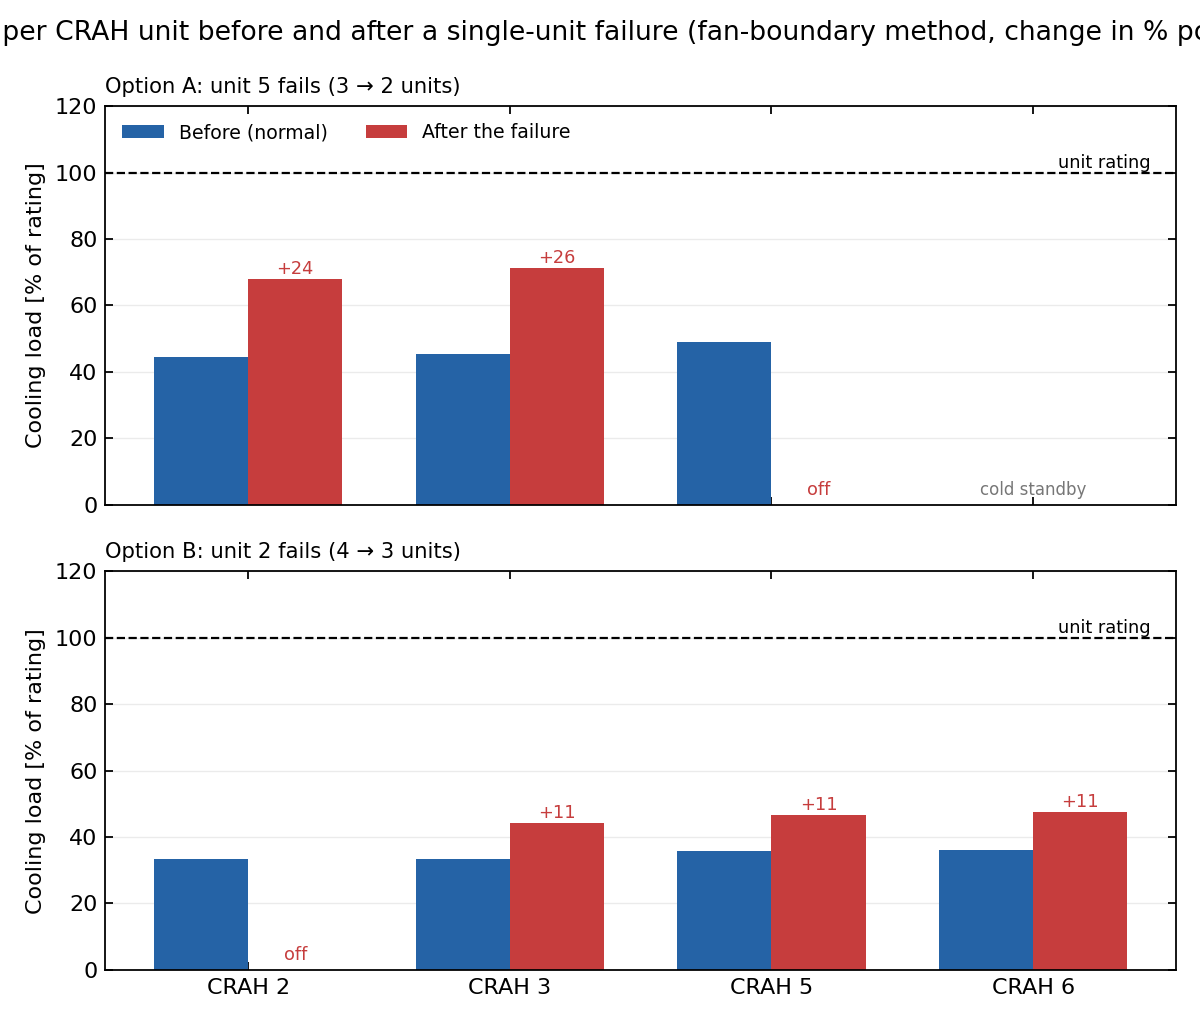
Fan-boundary approach with uniform-airflow control. Top: after CRAH 5 stops in A, the remaining two units gain 24 and 26 percentage points of load, respectively. Bottom: after CRAH 2 stops in B, the remaining three units each gain approximately 11 percentage points. Return-temperature differences produce load differences of several percentage points even with equal airflow.
Result 3: transient response to a single CRAH failure
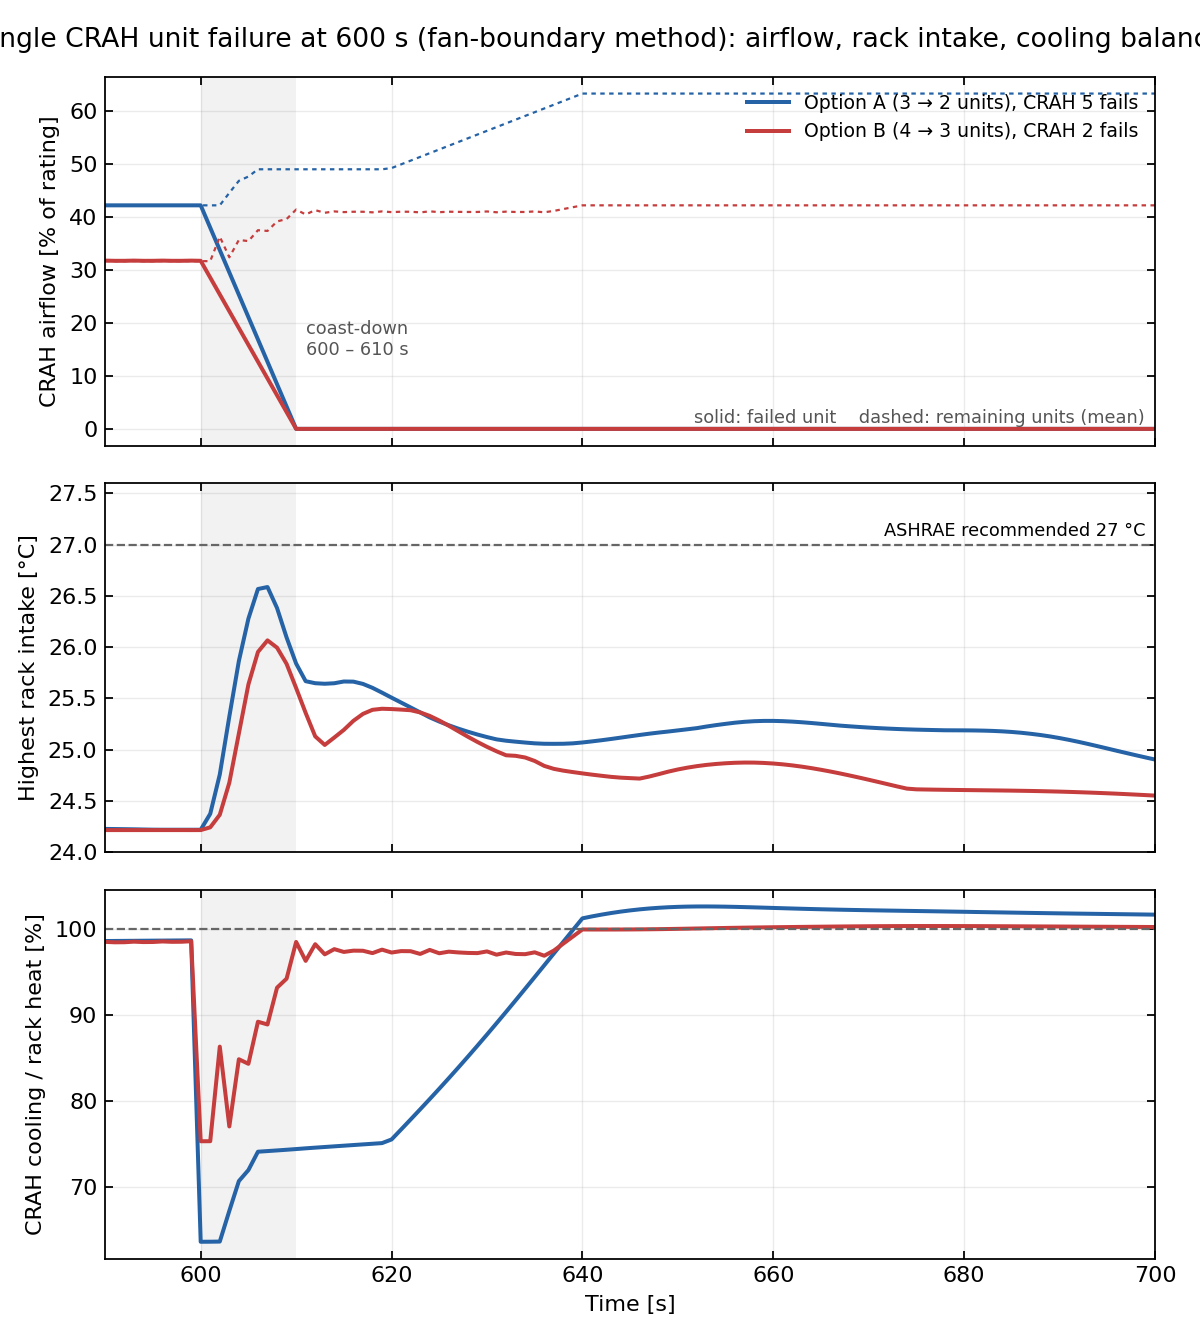
The two failure cases using the fan-boundary approach. Top: airflow through the failed CRAH, solid, and the average of the remaining units, dashed. Middle: maximum inlet temperature across all racks. Bottom: total CRAH cooling divided by rack heat generation. The gray band marks the 10 s coastdown period.
| Configuration | Failed CRAH | Peak rack inlet temperature | Above 27 °C | Minimum total cooling | Maximum required speed of remaining units | Return to normal range |
|---|---|---|---|---|---|---|
| A (3 → 2) | CRAH 5 | 26.6 °C at 607 s | No | 64% of rack heat at 601 s | 56% | 620 s |
| B (4 → 3) | CRAH 2 | 26.1 °C at 607 s | No | 75% at 601 s | 39% | 637 s |
The maximum rack inlet temperature peaked 7 s after failure, then fell below 26 °C within 10 s and reached 24.5–25 °C by 700 s. Both configurations remained below 27 °C throughout the assessment, and required fan speeds stayed within the specified limit. This response includes the assumption that the failed CRAH continues supplying uncooled air during coastdown. Actual behavior may differ with damper closure time and residual coil cooling.
Result 4: operating considerations
- Unequal CRAH loads: Return-air temperatures varied from 36 to 37.4 °C. Even with uniform-airflow control, the maximum CRAH load was 4–6% above the average. Capacity adequacy should therefore be assessed using individual maximum loads as well as the overall average.
- Low-load operation in B: With four units operating, required airflow per unit was approximately 32% of rated flow, and operating points were constrained by the specified 30% minimum fan speed. Cooling capacity criteria were met, but part-load control stability and start–stop cycling require review against manufacturer specifications and actual control conditions.
- Cooling reduction immediately after failure: In A, total cooling fell to 64% of rack heat generation during coastdown, then recovered to approximately 100% at 640 s when the remaining units completed their speed ramp. The thermal capacity of the plenum and room air affected this transient response. Maximum rack inlet temperature rose approximately 2.4 K above normal operation.
Conclusions and limitations
Under the specified load and control conditions, both configurations met the criteria during normal operation and following a single CRAH failure. Maximum post-failure CRAH load ratios were 71% for A and 50% for B, leaving approximately 29 and 50 percentage points of headroom relative to rated capacity. Peak rack inlet temperatures immediately after failure were 26.6 °C and 26.1 °C, respectively, both below 27 °C.
Failure reduced the number of available CRAHs and decreased cooling headroom in both configurations relative to normal operation. Comparing the same single-failure condition, B retained approximately 21 percentage points more headroom than A and had a 0.5 K lower transient peak temperature. However, B requires more continuously operating units and operation near minimum fan speed. Final selection should consider failure contingency margin, part-load control characteristics, and operating policy together.
The applicability of these results is subject to the following modeling assumptions:
- Supply temperature was set to 24 °C. A supply-temperature rise following a cooling-capacity exceedance can be represented only by the fan-boundary approach and was outside the scope of this assessment.
- Actual BMS PID and static-pressure control loops were not modeled. Operating points were calculated from fan curves according to a specified airflow schedule; actual controller delays and tuning characteristics are therefore excluded.
- Fan shutoff pressure was assumed because it was absent from the datasheet. These results apply to that assumed fan curve; operating points should be rechecked when the actual equipment curve becomes available.
- Rack airflow and heat loads used the supplied maximum specifications. Application to operating conditions requires review of the actual IT load distribution and equipment states.
Analysis scale and use in design review
| Item | Value |
|---|---|
| Number of cases | 8: 4 pressure-boundary and 4 fan-boundary cases |
| Mesh | 3.52 million cells, octree with refinement around racks |
| Runtime for a 1,000 s transient | 8–18 minutes per case on one RTX A2000 GPU |
| Features used | Porous racks with fan curves; cooling equipment with fan curves and capacity limits; time schedules and failure trips; hot-aisle containment internal walls; STEP geometry conversion; equipment airflow, load, and speed CSV outputs |
| Deliverables | Configuration assessment tables; temperature and flow planes and sections; failure transient histories; analysis plan and reports for both modeling approaches |
The project used a model of approximately 3.52 million cells to simulate 1,000 s transients, with runtimes of 8–18 minutes per case on one GPU. Eight conditions were compared by changing equipment operating configurations and failure and speed-ramp schedules within the same spatial model. This quantified CRAH load distribution and failure transients for different operating unit counts, providing comparative evidence for configuration selection.