
A pressure difference drives fully developed laminar flow through a square duct. Because velocity does not vary along the duct, advection vanishes and the momentum equation becomes a cross-sectional Poisson equation with a series solution. This case directly checks Boreas's no-slip conditions on four walls, diffusion solver, pressure-driven openings, and spatial convergence order. Results are from Boreas v0.10.0 on CPU; the two finest-mesh decks were also run on GPU.
Model and boundary conditions
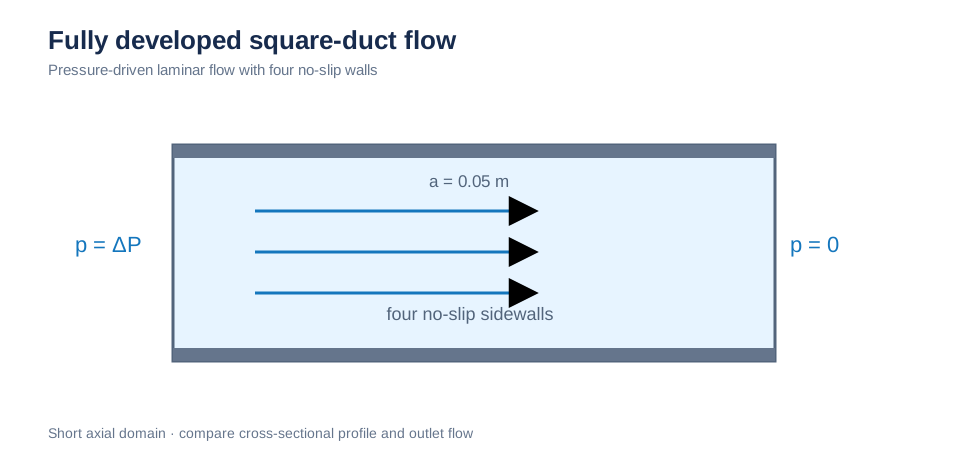
A pressure difference between the duct ends drives flow; all four sidewalls are no-slip. Velocity arrows show the resulting flow direction. Schematic; not to scale.
Analytical solution
For a square of side a, coordinates y′ and z′ measured from its center (|y′|, |z′| ≤ a/2), and pressure gradient G = −dp/dx, the fully developed velocity is (Shah and London, 1978):
The series gives fRe = 2a²G/(μu_mean) = 56.908 and u_max/u_mean = 2.0963, consistent with the published values 56.91 and 2.096. Boreas cell values are compared with the series evaluated at cell centers.
Simulation setup
| Item | Boreas setting |
|---|---|
| Duct | Square cross-section a = 0.05 m; axial length of four cells, since the fully developed solution is independent of the axial coordinate |
| Boundaries | Four no-slip walls; pressure outlets at both ends, with gauge pressure ΔP at the inlet and zero at the outlet |
| Fluid | ν = 1e-3 m²/s, ρ = 1.2 kg/m³, G = 0.4097 Pa/m (set for u_mean = 0.03 m/s; Re_Dh = 1.5) |
| Mesh | Uniform h = a/N, N = 8, 16, 32, 64 (up to 16,384 cells) |
| Time | dt = 0.01 s, 10 s total (four viscous times a²/ν = 2.5 s) |
| Advection | Semi-Lagrangian and upwind; both coincide because advection is zero |
| Comparison | RMS and maximum cell-center differences at the mid-duct cross-section, normalized by u_max; mean velocity and fRe from outlet flow |
Velocity profile
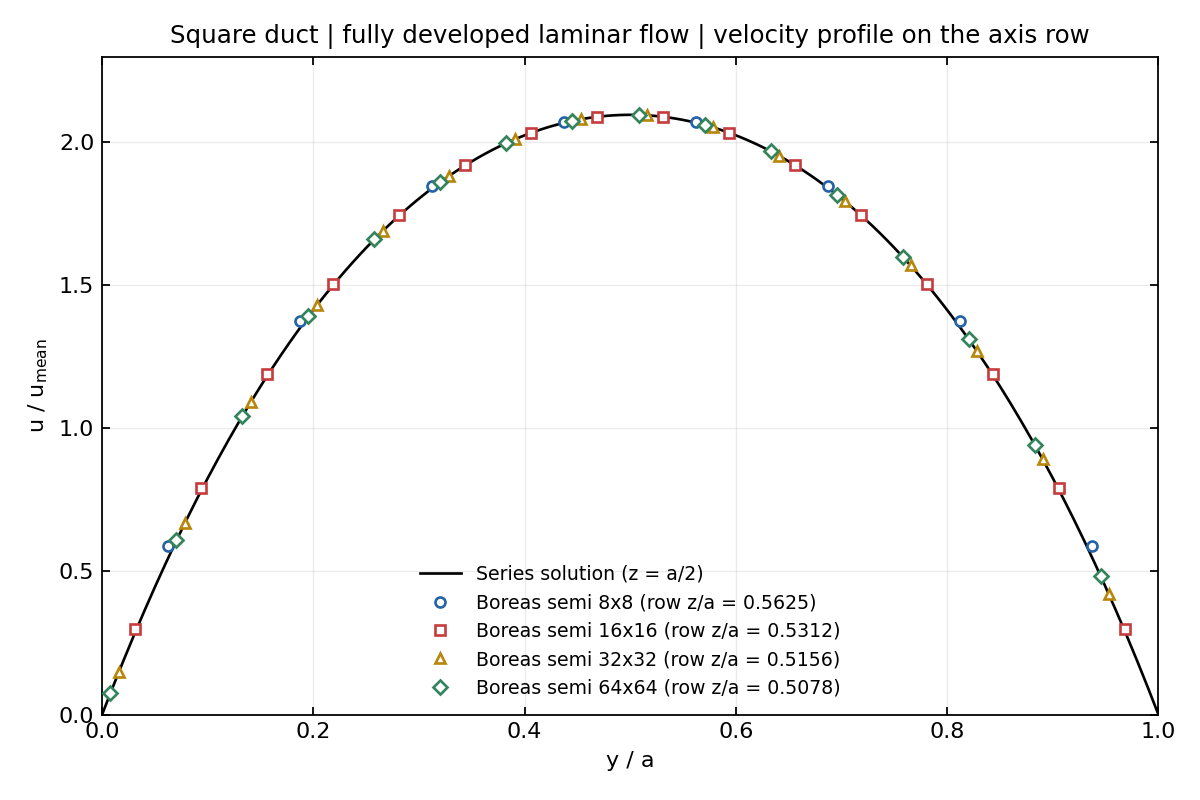
Markers show semi-Lagrangian velocities in the cell row nearest the duct axis; the solid line is the series solution. Coarse-mesh rows lie half a cell away from the axis (z/a in the legend). Errors are calculated against the series at each actual cell center.
Mesh convergence
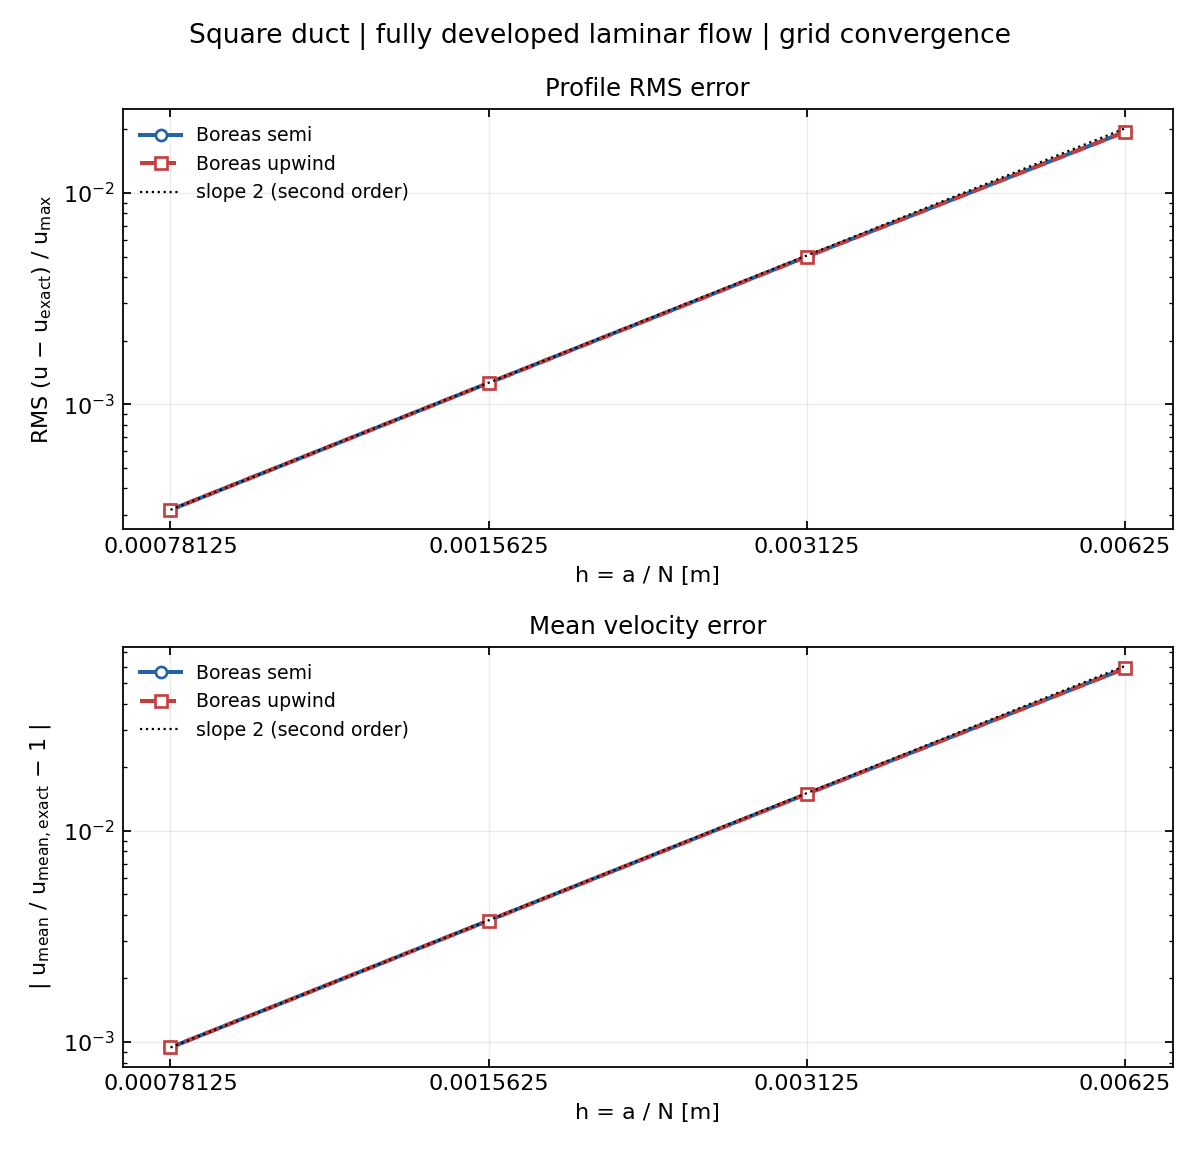
Top: cross-sectional RMS profile error normalized by u_max. Bottom: mean-velocity error. Dashed guides have second-order slope. Semi-Lagrangian and upwind overlap.
| N | 8 | 16 | 32 | 64 |
|---|---|---|---|---|
| Mean velocity error [%] | +5.878 | +1.496 | +0.376 | +0.094 |
| fRe | 53.75 | 56.07 | 56.70 | 56.86 |
| Profile RMS error/u_max | 1.94e-2 | 5.00e-3 | 1.26e-3 | 3.16e-4 |
| Maximum profile error/u_max | 2.34e-2 | 6.26e-3 | 1.61e-3 | 4.09e-4 |
All errors fall by about a factor of four when mesh spacing is halved (ratios 3.9–4.0), consistent with second-order centered diffusion and the half-cell Dirichlet wall condition. On coarse meshes, mean velocity is too high and fRe too low because a one-cell linear approximation underestimates wall shear. This error vanishes at the same order under refinement.
Transient history and CPU–GPU comparison
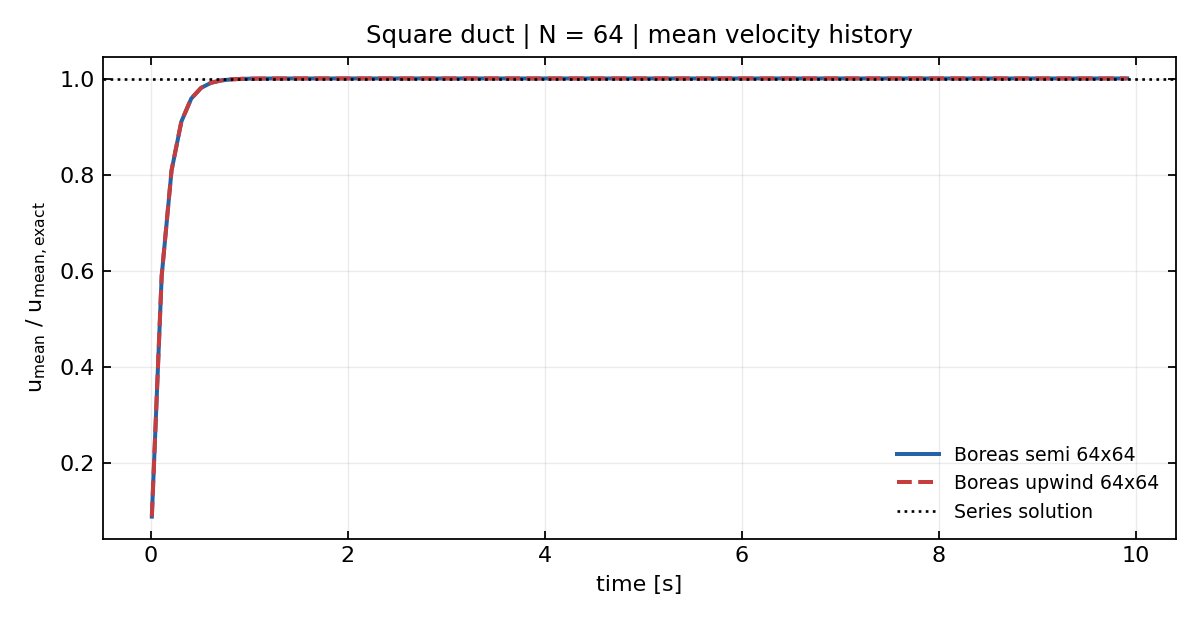
Mean velocity relative to the series solution for N = 64. Steady state is reached in about 2 s; semi-Lagrangian and upwind overlap.
Both N = 64 decks were also run on GPU. GPU mean-velocity error is +0.089% (CPU +0.094%), and profile RMS error is 2.96e-4 (CPU 3.16e-4). The differences are on the scale of the fp32 diffusion-solver tolerance.
Quantitative results
| Metric | Value |
|---|---|
| Mean velocity error, N = 64 [%] | +0.094 |
| fRe, N = 64 (series: 56.908) | 56.86 |
| Profile RMS error/u_max, N = 64 | 3.16e-4 |
| Mesh convergence order, N = 8–64 | 2 |
| GPU mean velocity error, N = 64 [%] | +0.089 |
Because advection is zero, this case does not assess advection-scheme accuracy. See the flat-plate boundary-layer and lid-driven-cavity validations for cases with advection.