
A room initially at 26 °C receives 18 °C air through a central ceiling diffuser and exhausts through two floor-corner outlets. This computational case assesses energy conservation and mesh convergence in a ventilated room with supply, exhaust, mixing, and buoyancy. The acceptance criterion is the exact room energy balance integrated with simulated outlet temperatures. The well-mixed model used by Risbeck et al. (2021) provides a reference for interpreting cooling rate; departure from it describes mixing efficiency, not numerical error. This case does not compare directly with experimental measurements. Results are from Boreas v0.10.0 on GPU; no same-deck CPU run has been made.
Model and boundary conditions
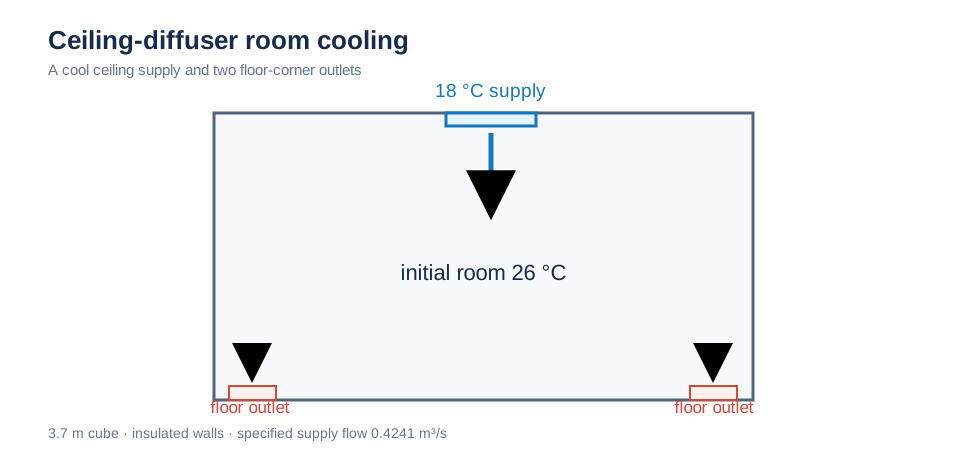
A central ceiling diffuser supplies 18 °C air; two floor-corner outlets exhaust it. The room starts at 26 °C and has insulated walls. Schematic; not to scale.
Reference models
For room volume V, supply flow Q, inlet temperature T_in, mean room temperature T_mean, and outlet temperature T_out, with insulated walls and no internal heat source:
Integrating this with the simulated T_out tests energy conservation. A well-mixed model sets T_out = T_mean and gives:
Some cool supply air can reach the outlet before mixing with the room, making T_out closer to T_in than T_mean. Mixing efficiency ε = (T_out − T_in)/(T_mean − T_in) equals one for perfect mixing. Values below one indicate supply short-circuiting and slower cooling than the well-mixed prediction.
Simulation setup
| Item | Boreas setting |
|---|---|
| Room | Cube of side L = 3.7 m (V = 50.65 m³), insulated walls, initial T₀ = 26 °C |
| Diffuser | Central ceiling opening 0.6 × 0.6 m, specified flow Q = 0.4241 m³/s (nominal face speed 1.178 m/s), T_in = 18 °C; specifying Q holds flow fixed as represented inlet area changes with mesh |
| Outlets | Two 0.6 × 0.6 m pressure outlets in floor corners |
| Time constant | τ = V/Q = 119.4 s |
| Air and buoyancy | ρ = 1.2 kg/m³, c_p = 1005 J/(kg·K), ν = 1.5e-5 and α = 2.1e-5 m²/s; Boussinesq β = 0.0034 K⁻¹ referenced to 26 °C |
| Turbulence and advection | Chen zero-equation model; first-order upwind (primary result) and semi-Lagrangian |
| Mesh | Uniform h0 = 0.2, 0.1, 0.05 m (14,000, 51,000, 405,000 cells) |
| Time | dt = 0.5 s, 800 s total (6.7 τ) |
| Comparison | Room volume-average temperature and outlet mass-average temperatures and flows monitored every 2 s |
Room dimensions are set for this validation from conditions and the approximately 120 s time constant in an earlier public example. They are not dimensions reported by Risbeck et al. (2021).
Results
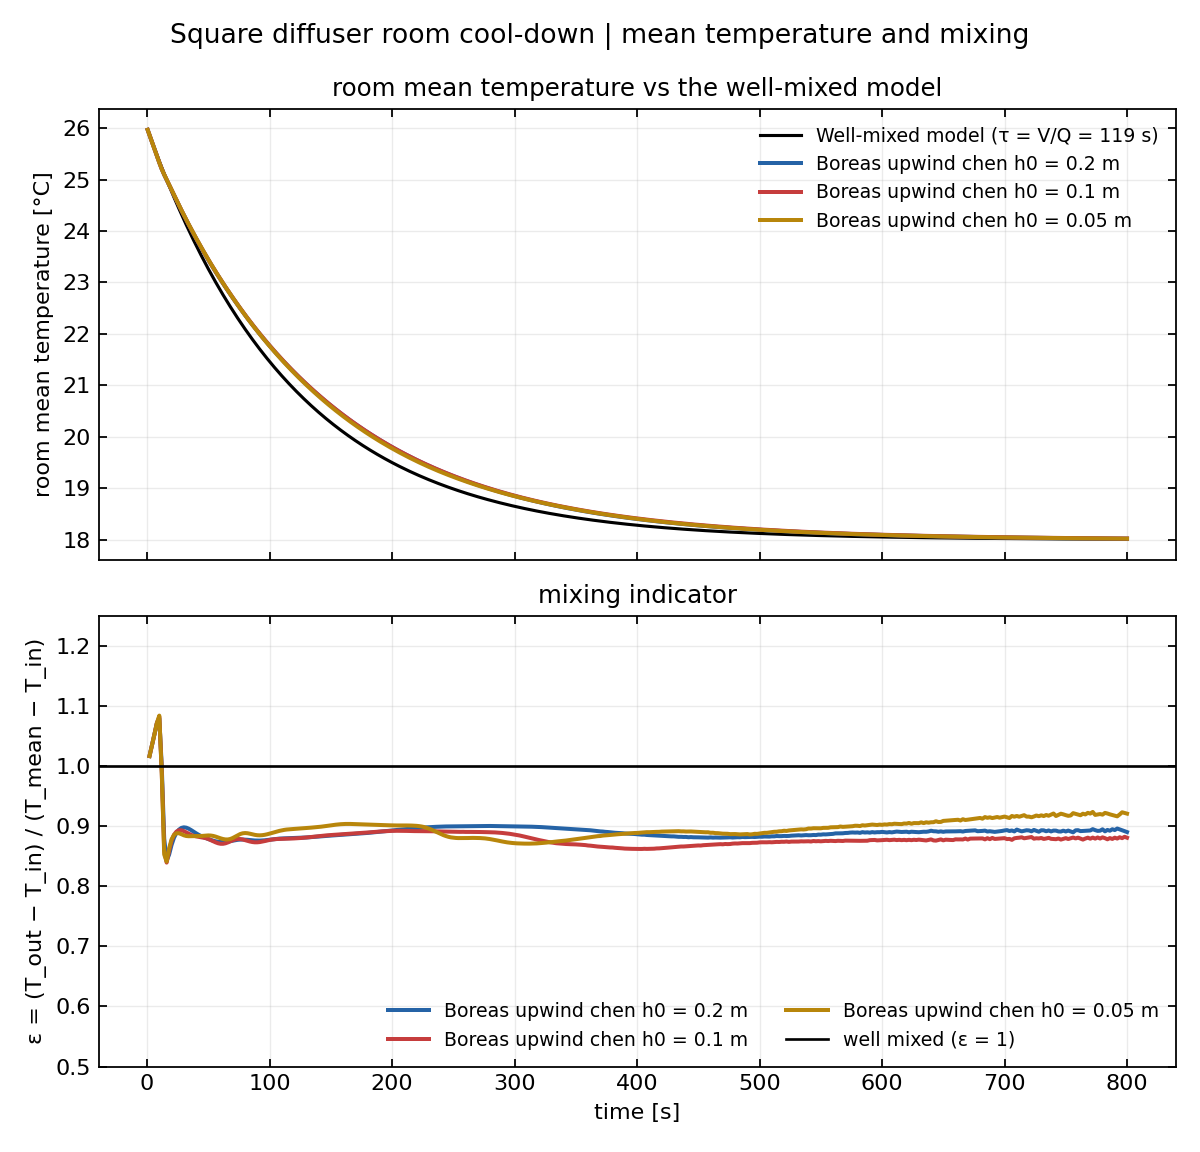
Top: the three upwind room-average curves overlap; black is the well-mixed model. Bottom: ε. During the first 10 s, cold supply has not reached the outlets and displaces warm air, giving ε > 1. Thereafter ε settles near 0.86–0.92.
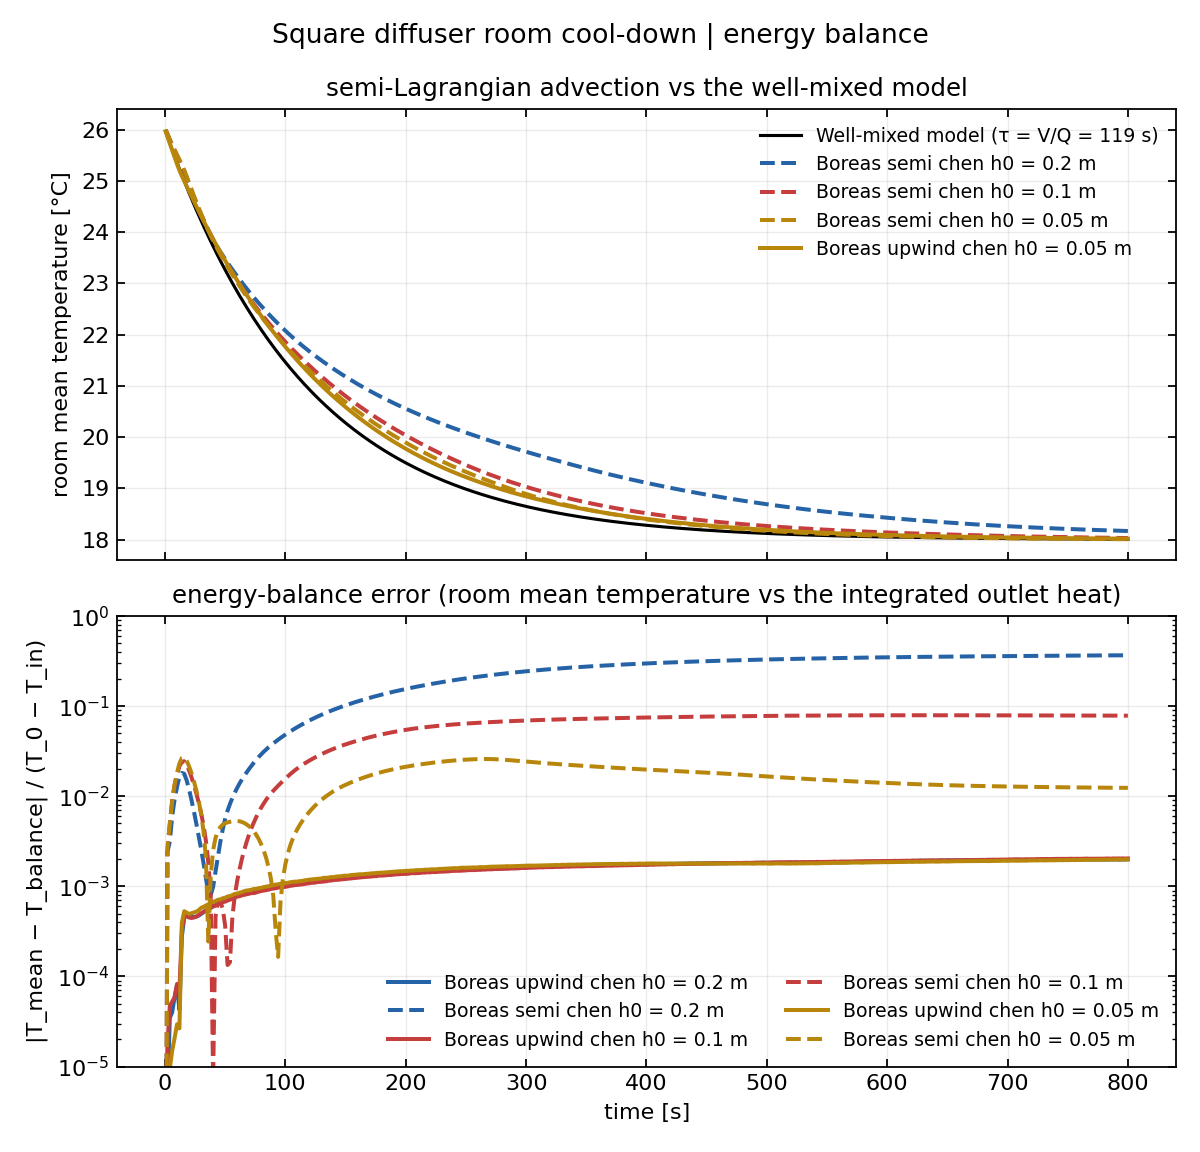
Top: semi-Lagrangian on three meshes (dashed), upwind at h0 = 0.05 m, and the well-mixed model. Bottom: |T_mean − T_balance|/(T₀ − T_in) on a log scale. Upwind saturates at 0.2% on every mesh; semi-Lagrangian improves only to 2.7% under refinement.
Quantitative results
| Advection | h0 [m] | Cells | Maximum energy-balance error relative to ΔT₀ | T_mean at 200 s [°C] | ε at 200 s |
|---|---|---|---|---|---|
| Upwind | 0.2 | 14,000 | 0.20% | 19.80 | 0.893 |
| Upwind | 0.1 | 51,000 | 0.20% | 19.80 | 0.892 |
| Upwind | 0.05 | 405,000 | 0.20% | 19.77 | 0.902 |
| Semi | 0.2 | 14,000 | 36.8% | 20.56 | 0.879 |
| Semi | 0.1 | 51,000 | 7.9% | 20.04 | 0.902 |
| Semi | 0.05 | 405,000 | 2.7% | 19.89 | 0.903 |
| Well-mixed model | — | — | — | 19.50 | 1 |
- Upwind conserves energy and is mesh independent. The 0.2% balance error comes from trapezoidal integration of 2 s monitor samples during the initial sharp outlet-temperature change. It is identical across meshes and does not grow later. T_mean at 200 s differs by at most 0.03 K.
- Cooling 0.3 K more slowly than the well-mixed model is a physical result. At ε ≈ 0.89, roughly 10% of supply air reaches the floor outlets before mixing, explaining the warmer mean temperature.
- Semi-Lagrangian does not close the balance. Its error falls from 36.8% to 2.7% under refinement but remains nonzero; at h0 = 0.2 m cooling is 0.8 K slower by 400 s.
- Outlet flows sum to the 0.4241 m³/s supply in every run.
Limits
- Semi-Lagrangian results are excluded from heat-balance and convergence conclusions because this advection method does not conserve heat here. Use upwind for temperature and heat-balance analysis.
- These are GPU-only runs; no same-deck CPU comparison is available. The identical 0.2% balance error across meshes and advection runs offers no indication of a GPU-specific defect.
- The geometry was reconstructed for this case. There is no direct comparison with numerical results in Risbeck et al. (2021); the well-mixed model is the external reference.
Reference
- Risbeck, M. J., Bazant, M. Z., Jiang, Z., Lee, Y. M., Drees, K. H., and Douglas, J. D. (2021). “Modeling and multiobjective optimization of indoor airborne disease transmission risk and associated energy consumption for building HVAC systems.” Energy and Buildings, 253, 111497. DOI: 10.1016/j.enbuild.2021.111497.