
A sealed 0.6 × 0.6 × 1.2 m cabinet starts from rest at 25 °C. A 0.4 × 0.3 m patch on one wall is held at −10 °C, with other walls insulated. Natural convection near the patch drives the flow, and its thin thermal boundary layer controls the cooling rate. These are Boreas v0.10.0 results. The energy-balance check used CPU (boreas2); the wall-refinement and time-step ladder used both GPU (boreas2_gpu) and CPU.
Finding: Upwind energy balance closes within 0.5%. Wall heat-transfer rate has not been validated, because cooling does not converge with either wall-cell size or time step in the tested range. This page records that limitation for a thin natural-convection boundary layer on a coarse background mesh. Agreement with the approximate lumped-capacitance model is not claimed.
Model and boundary conditions
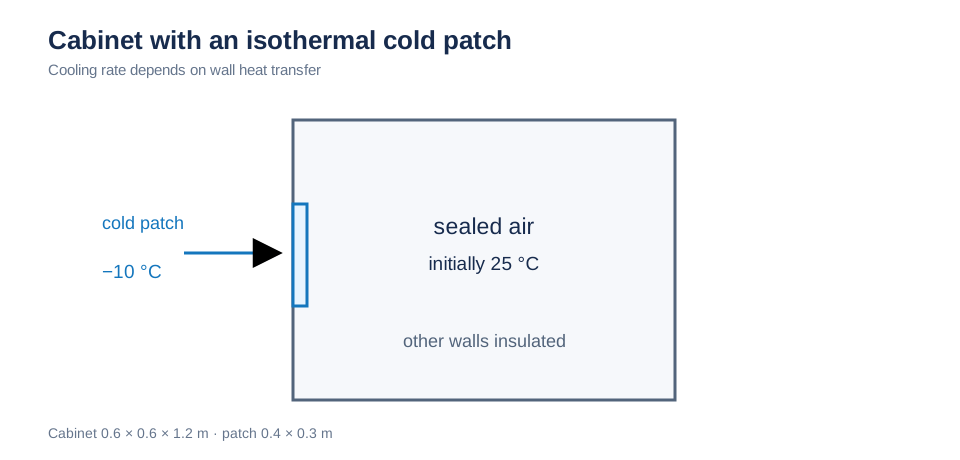
A wall patch in the sealed cabinet is held at −10 °C; other walls are insulated. Initial air temperature is 25 °C. Schematic; not to scale.
Reference criteria
Exact energy balance. Heat crosses the cabinet boundary only at the cooling patch, so stored energy must equal integrated wall heat:
Boreas records Q_wall at each step. A nonzero residual indicates numerically created or lost heat.
Lumped-capacitance plausibility model. If cabinet air is assumed well mixed and the patch is treated as a vertical plate of height L = 0.3 m, the laminar natural-convection correlation Nu = 0.59 Ra^{1/4} gives h for θ = T_mean − T_c:
Here c = C_h A/(ρc_pV). Initially θ₀ = 35 K, h = 4.98 W/(m²·K), and the characteristic time is 872 s. This approximate model ignores stratification beneath the patch and is only an order-of-magnitude check. Mesh and time-step convergence, not agreement with this model, determine whether Boreas's cooling rate is resolved.
Simulation setup
| Item | Boreas setting |
|---|---|
| Cabinet | Sealed 0.6 × 0.6 × 1.2 m (x, y, z), no flow openings |
| Cooling patch | On x = 0 wall, 0.4 × 0.3 m, centered at y = 0.3 m and z = 0.6 m; isothermal at −10 °C; other walls insulated |
| Air and buoyancy | ρ = 1.2 kg/m³, c_p = 1005 J/(kg·K), ν = 1.5e-5 m²/s, α = 2.1e-5 m²/s; Boussinesq β = 3.4e-3 K⁻¹ referenced to 25 °C |
| Balance check | Uniform 50 mm (12 × 12 × 24) and 25 mm (24 × 24 × 48) × semi-Lagrangian/upwind × laminar/Chen; eight CPU decks, dt = 0.5 s, 4000 s |
| Wall and dt ladder | 50 mm background with near-patch/cold-layer cells refined to 12.5, 6.25, 3.125 mm; upwind + laminar; dt = 0.5, 0.25, 0.125, 0.0625 s for 1000 s on GPU, with 6.25 mm cases also on CPU |
| Comparison | Volume-average temperature, integrated wall heat versus stored energy, and h_eff = −Q_wall/[A(T_mean − T_c)] |
Energy balance and cooling rate
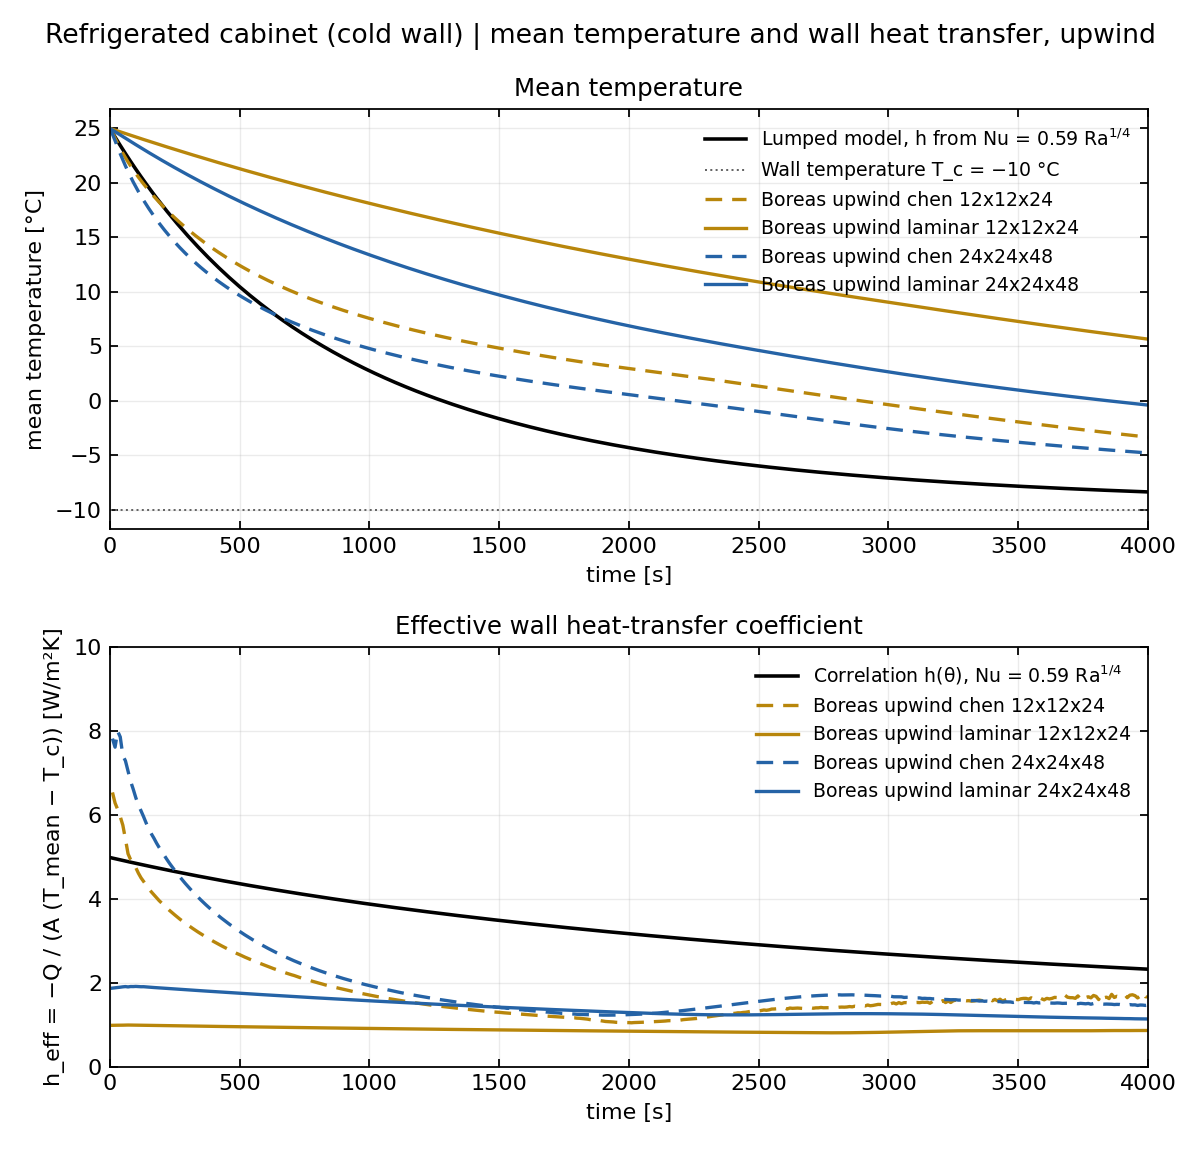
Four upwind combinations from the eight uniform-mesh decks. Top: mean temperature and approximate lumped model (black). Bottom: effective h_eff and correlation h(θ). Cooling rate changes substantially between 50 and 25 mm and across turbulence models; h_eff remains about one fifth to two fifths of the correlation value.
| Advection | Turbulence | Mesh | Balance error [%] | T_mean(1000 s) [°C] | T_mean(4000 s) [°C] | h_eff(1000 s) [W/(m²·K)] |
|---|---|---|---|---|---|---|
| Upwind | Laminar | 12 × 12 × 24 | 0.01 | 18.13 | 5.67 | 0.91 |
| Upwind | Chen | 12 × 12 × 24 | 0.35 | 7.57 | −3.33 | 1.70 |
| Upwind | Laminar | 24 × 24 × 48 | 0.03 | 13.40 | −0.39 | 1.57 |
| Upwind | Chen | 24 × 24 × 48 | 0.49 | 4.80 | −4.78 | 1.93 |
| Semi-Lagrangian | Laminar | 12 × 12 × 24 | 24.2 | 18.56 | 8.54 | 0.92 |
| Semi-Lagrangian | Chen | 12 × 12 × 24 | 20.6 | 10.20 | 1.34 | 1.61 |
| Semi-Lagrangian | Laminar | 24 × 24 × 48 | 3.2 | 13.06 | 0.71 | 1.57 |
| Semi-Lagrangian | Chen | 24 × 24 × 48 | 4.0 | 5.32 | −2.48 | 1.90 |
| Approximate lumped model | — | — | — | 2.76 | −8.35 | 4.98 initially |
- Conservation: All four upwind cases close within 0.5%. Wall heat is calculated consistently with the diffusion solve. Why Chen's 0.35–0.49% residual exceeds laminar's 0.01–0.03% by an order of magnitude remains unresolved. Semi-Lagrangian misses by 3–24% and is not suitable for heat-balance-sensitive runs here.
- Cooling rate: Mean temperature at 1000 s ranges from 4.8 to 18.1 °C across mesh and turbulence settings, far warmer than the lumped model. The estimated thermal-boundary-layer thickness L/Nu ≈ 5 mm is unresolved by 25–50 mm cells; sensitivity to turbulence model is another indication of insufficient resolution.
Wall-refinement and time-step ladder
Wall cells were refined to 12.5, 6.25, and 3.125 mm while dt was reduced from 0.5 to 0.0625 s.
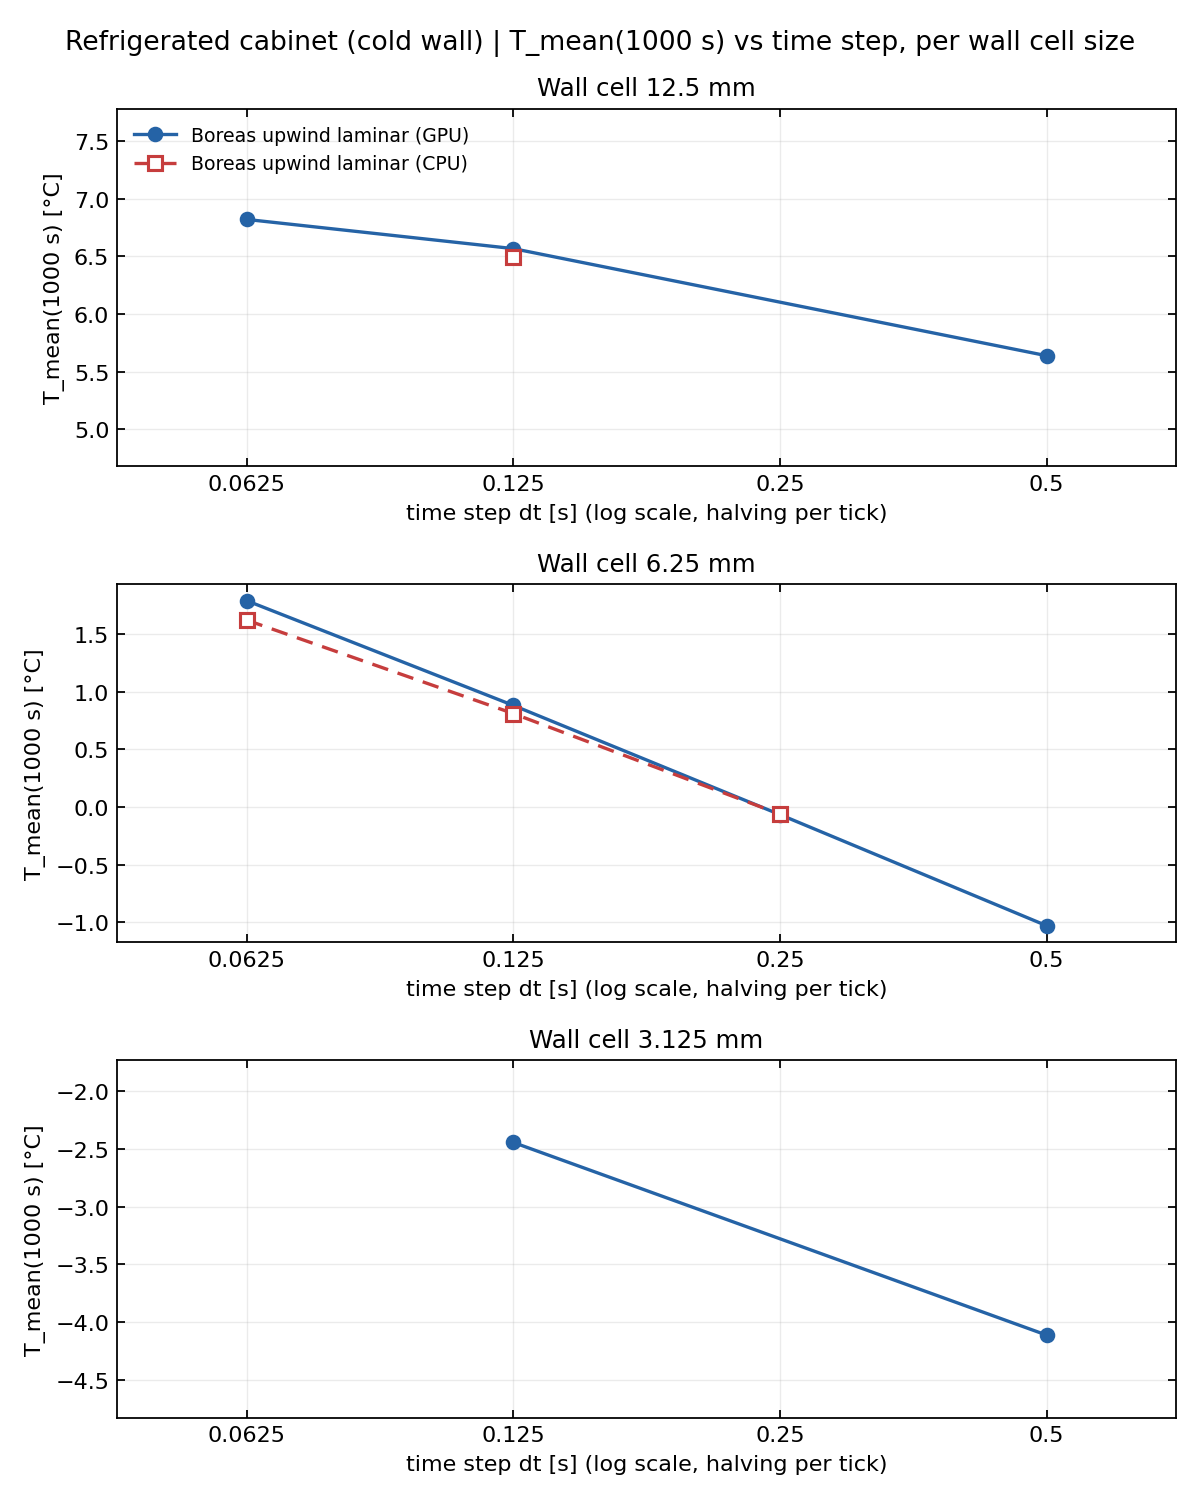
Each panel is a wall-cell size; the horizontal log axis halves dt at each tick and all panels share vertical span. At 6.25 mm, mean temperature at 1000 s shifts by about 0.85 K in the same direction with every dt halving, without shrinking increments. The largest GPU–CPU difference is 0.17 K, smaller than the roughly 0.85 K time-step shifts, so the dependence is unlikely to be GPU specific.
| Solver | Wall cell [mm] | dt [s] | T_mean(1000 s) [°C] | h_eff(250 s) [W/(m²·K)] | Balance error at 1000 s [%] |
|---|---|---|---|---|---|
| GPU | 12.5 | 0.5 · 0.125 · 0.0625 | 5.64 · 6.57 · 6.82 | 3.48 · 3.34 · 3.30 | −0.05 · −0.72 · −0.61 |
| GPU | 6.25 | 0.5 · 0.25 · 0.125 · 0.0625 | −1.03 · −0.07 · 0.88 · 1.79 | 5.55 · 5.48 · 5.29 · 5.08 | −0.12 · −0.28 · −1.10 · −1.88 |
| CPU | 6.25 | 0.25 · 0.125 · 0.0625 | −0.06 · 0.81 · 1.62 | 5.48 · 5.29 · 5.08 | −0.29 · −0.39 · −0.47 |
| GPU | 3.125 | 0.5 · 0.125 | −4.11 · −2.44 | 4.85 · 5.69 | −0.22 · −2.23 |
- Wall cells: At dt = 0.125 s, h_eff(250 s) rises 3.34 → 5.29 → 5.69 W/(m²·K) as wall cells shrink. This approaches the correlation's roughly 4.6 at θ = 26 K, but h_eff itself moves with dt (5.55 → 5.08 at 6.25 mm).
- Time step: At 6.25 mm, changes in T_mean(1000 s) after each dt halving are 0.96, 0.95, 0.91 K on GPU and 0.87, 0.81 K on CPU. First-order temporal convergence would halve each increment; dt = 0.0625 s is not in that asymptotic range.
- Instability: With dt = 0.5 s, refined 6.25 and 3.125 mm cases diverge after about 3800 and 1500 s, respectively, as unsuccessful implicit upwind steps accumulate. Refinement requires a smaller dt.
- GPU balance drift: GPU balance error grows with step count from roughly −0.1% to −1.9%. This GPU energy drift was fixed in v0.10.1. CPU has the same dt-dependent cooling rate, so drift does not explain the lack of convergence.
Quantitative results
| Metric | Value |
|---|---|
| Upwind balance error, 4000 s CPU | Laminar 0.01%, 0.03%; Chen 0.35%, 0.49% |
| Semi-Lagrangian balance error | 3.2–24.2%, nonconservative |
| h_eff at 1000 s on uniform 25–50 mm meshes | 0.91–1.93 W/(m²·K), versus 4.98 from the correlation initially |
| h_eff at 250 s, wall cells 12.5 → 3.125 mm, dt = 0.125 s | 3.34 → 5.29 → 5.69 W/(m²·K), versus correlation about 4.6 |
| T_mean shift at 1000 s per dt halving, 6.25 mm wall cells | GPU 0.96, 0.95, 0.91 K; CPU 0.87, 0.81 K — not converged |
| Same-deck GPU − CPU T_mean difference at 1000 s | 0.07–0.17 K |
Limits
- Wall heat transfer and cooling rate are not quantitatively validated for v0.10.0. Neither the three wall resolutions nor four time steps establish a converged value. Agreement of the mean-temperature curve with a lumped model or other benchmark cannot be claimed. An August 2026 statement of qualitative agreement compared only curve shape with an exponential of unspecified h and is withdrawn.
- A working hypothesis is numerical diffusion from temporal discretization. Implicit Euler plus first-order upwind adds streamwise diffusion on the order of u²dt/2. For near-wall descent speeds of 0.1–0.2 m/s, even dt = 0.0625 s gives 15–60 times the air thermal diffusivity (2.1e-5 m²/s), and CFL on 6.25 mm cells is 1–2. Reaching u dt < h/4 may require dt ≲ 0.01 s, around 100,000 cells × 100,000 steps. A next check would compare CPU at 6.25 mm with dt = 0.03 and 0.015 s to see whether increments begin shrinking.
- This limit concerns a thin natural-convection boundary layer on a coarse mesh. For sealed spaces cooled only by an isothermal wall, reduce wall-cell size and dt together and verify convergence before making quantitative predictions.
- The energy-balance check used CPU. GPU Chen wall heat was recorded with a pre-update effective diffusivity and was not used to judge that balance. The time-step ladder gives similar cooling rates on GPU and CPU.