
A sealed 0.6 × 0.6 × 1.2 m cabinet starts from rest at 25 °C. A 0.4 × 0.3 m wall patch applies a constant cooling flux q″ = −50 W/m² (−6 W); other walls are insulated. Because heat crosses only this patch, the volume-average temperature must follow an exact straight line independently of circulation, stratification, or turbulence model. This directly tests heat conservation by Boreas's advection methods. Results are from Boreas v0.10.0 on GPU (boreas2_gpu); no CPU comparison was run.
Model and boundary conditions
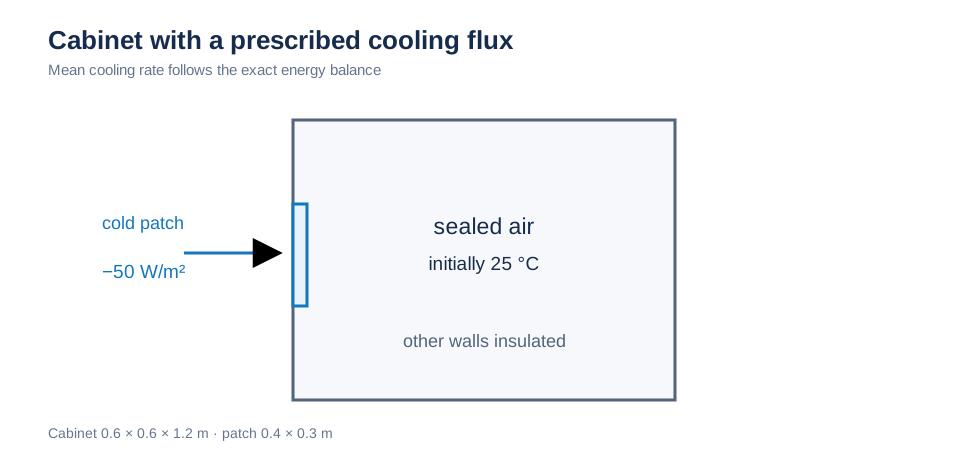
A wall patch in the sealed cabinet has a −50 W/m² cooling flux; other walls are insulated. Initial air temperature is 25 °C. Schematic; not to scale.
Exact energy balance
Let q = 50 W/m² be cooling-flux magnitude and A = 0.12 m² the patch area. Then:
With air ρ = 1.2 kg/m³, c_p = 1005 J/(kg·K), and V = 0.432 m³, the slope is −1.1516 × 10⁻² K/s (−11.5 K per 1000 s), and mean temperature at 5000 s is −32.583 °C. Any departure from this flow-independent line indicates numerical heat creation or loss. The −32.583 °C value assumes constant properties and constant flux throughout; it is a numerical conservation target, not a prediction of a real refrigerator's operating temperature.
Simulation setup
| Item | Boreas setting |
|---|---|
| Cabinet | Sealed 0.6 × 0.6 × 1.2 m (x, y, z), no flow openings |
| Cooling patch | On x = 0 wall, 0.4 × 0.3 m, centered at y = 0.3 m and z = 0.6 m; −50 W/m² (−6 W); other walls insulated |
| Air and buoyancy | ρ = 1.2 kg/m³, c_p = 1005 J/(kg·K), ν = 1.5e-5 m²/s, α = 2.1e-5 m²/s; Boussinesq β = 3.4e-3 K⁻¹ referenced to 25 °C |
| Mesh | Uniform 50 mm (12 × 12 × 24, 3,456 cells) and 25 mm (24 × 24 × 48, 27,648 cells) |
| Advection and turbulence | Semi-Lagrangian and upwind × laminar and Chen zero-equation: eight decks |
| Time | dt = 0.5 s, 5000 s (10,000 steps) |
| Comparison | Volume-average temperature every 10 s versus the balance line; boundary heat and balance residual |
Mean temperature
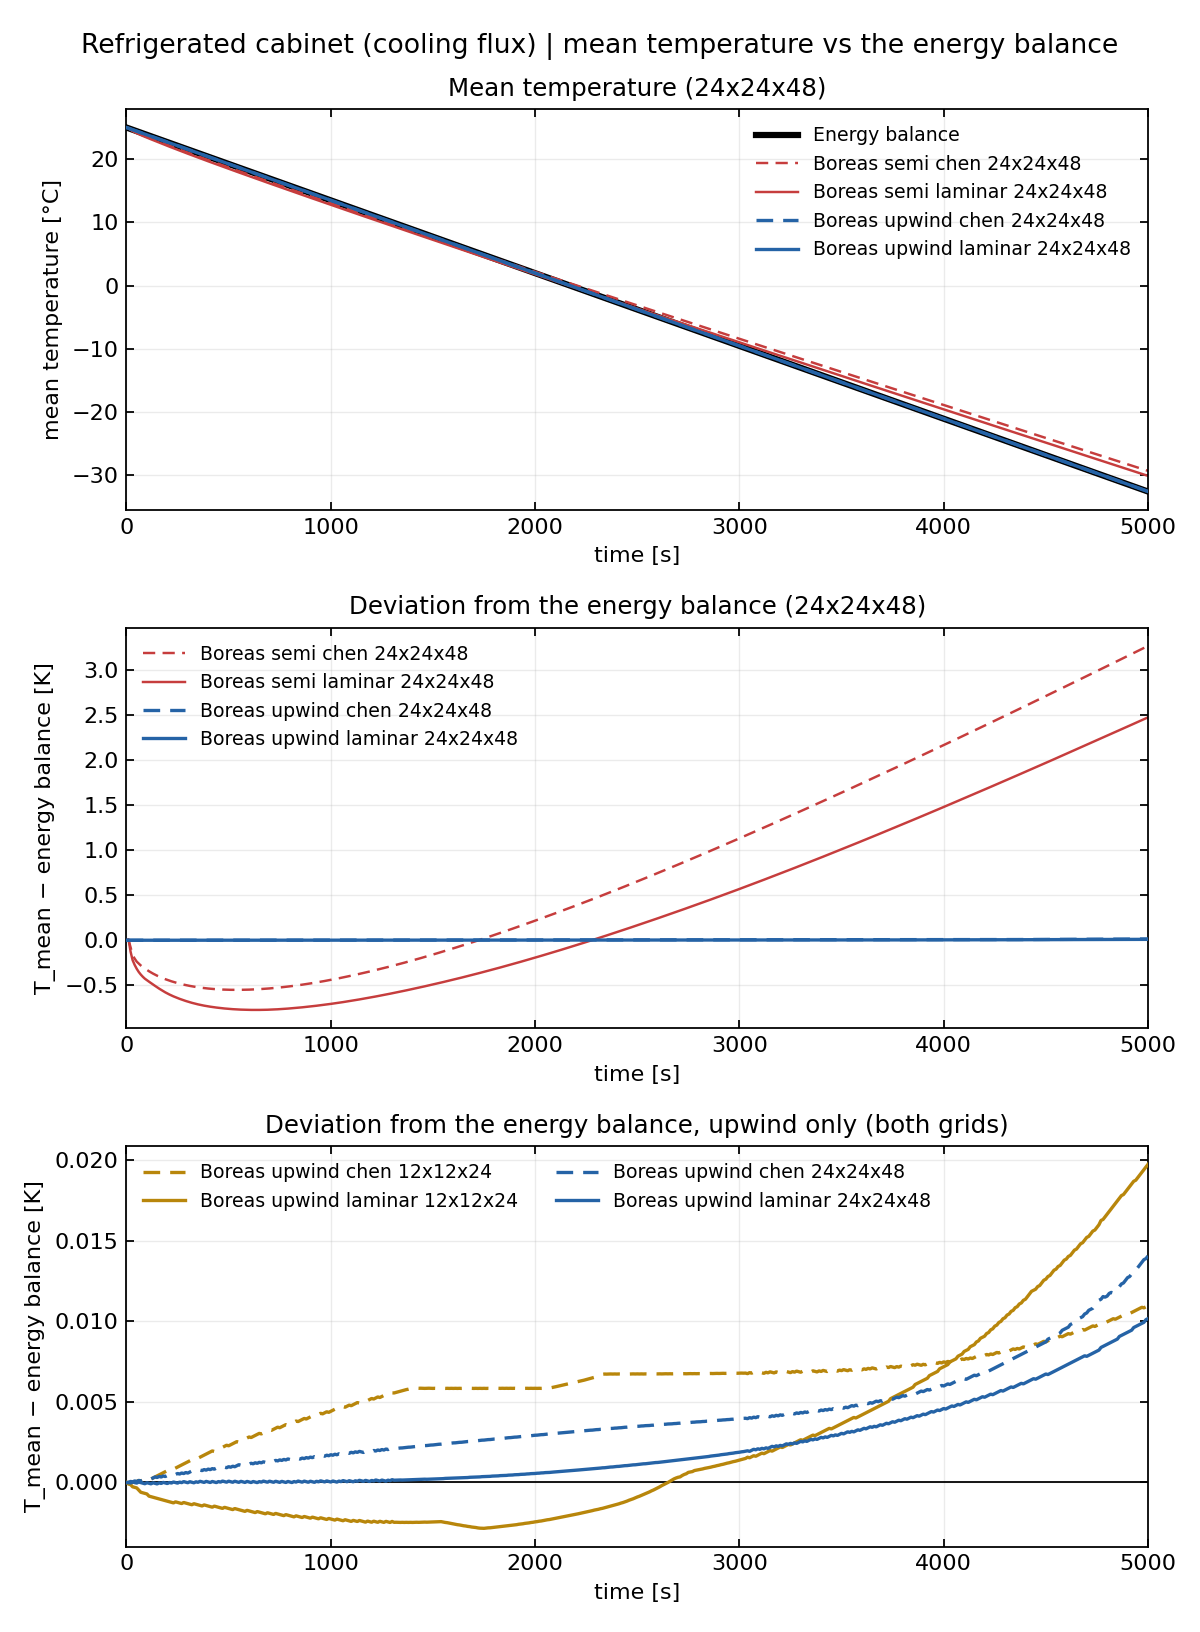
Top: four combinations on the 24 × 24 × 48 mesh and the balance line. Both upwind curves lie on the line; both semi-Lagrangian curves drift above it later. Middle: deviations from the line. Bottom: upwind deviations for both meshes and turbulence models, enlarged to a 0.02 K scale.
Upwind stays within 0.02 K of the exact line through 5000 s, independent of mesh and turbulence model (within 0.03% of the 57.6 K cooling). Flux-form discretization cancels internal cell-to-cell heat transfers. The remaining 0.01–0.02 K is consistent with rounding accumulated during 10,000 steps of single-precision field storage.
Semi-Lagrangian initially cools too quickly (up to −0.7 K relative to the line), then too slowly. At 5000 s it finishes 2.5–3.3 K high on the 25 mm mesh and 12–13 K high on the 50 mm mesh. Backtraced interpolation is nonconservative and can create or remove heat depending on stratification and cold-air descent. Refinement reduces the cooling error from about −22% to −5% without eliminating it. Reducing dt from 0.5 to 0.1 s on the same 25 mm deck raises the 2000 s error from +0.8% to +4.2%.
Stratification
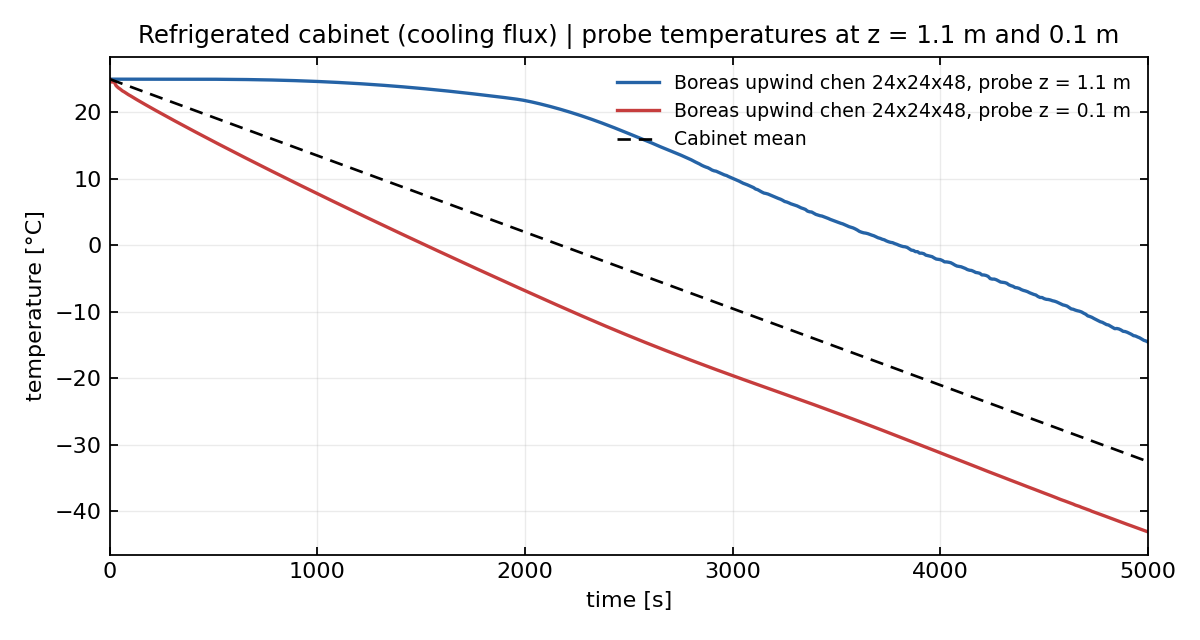
24 × 24 × 48, upwind + Chen. Cold air descending from the patch pools at the floor. The lower probe (z = 0.1 m) cools first; the upper probe (z = 1.1 m) begins cooling substantially only after about 2000 s. Despite stratification, the cabinet mean (dashed) follows the exact line.
Quantitative results
| Advection | Turbulence | Mesh | T_mean(5000 s) [°C] | Difference from exact [K] | Cooling error [%] | Maximum heat-balance residual [%] |
|---|---|---|---|---|---|---|
| Upwind | Laminar | 12 × 12 × 24 | −32.563 | +0.020 | −0.03 | 0.17 |
| Upwind | Chen | 12 × 12 × 24 | −32.572 | +0.011 | −0.02 | 0.07 |
| Upwind | Laminar | 24 × 24 × 48 | −32.572 | +0.010 | −0.02 | 0.09 |
| Upwind | Chen | 24 × 24 × 48 | −32.568 | +0.014 | −0.02 | 0.14 |
| Semi-Lagrangian | Laminar | 12 × 12 × 24 | −19.786 | +12.80 | −22.2 | 29.0 |
| Semi-Lagrangian | Chen | 12 × 12 × 24 | −20.402 | +12.18 | −21.2 | 27.5 |
| Semi-Lagrangian | Laminar | 24 × 24 × 48 | −30.105 | +2.48 | −4.3 | 8.9 |
| Semi-Lagrangian | Chen | 24 × 24 × 48 | −29.311 | +3.27 | −5.7 | 9.7 |
The exact T_mean(5000 s) is −32.583 °C. Cooling error is (T_mean − T₀)/(exact slope × t) − 1. Boundary heat is exactly −6.000 W in every deck, locating the discrepancy in internal advection rather than the imposed wall flux.
Scope and limits
- Do not use semi-Lagrangian advection where heat balance controls the result, such as sealed spaces, heated equipment, or supply–exhaust heat accounting. Its heat error changes sign and size with mesh, time step, and elapsed time.
- This is a conservation test. The exact line does not depend on flow, so it cannot validate natural convection or stratification; see the isothermal cooling-wall case for that separate question.
- Only GPU was run; the eight decks were not compared with CPU.