
This benchmark heats the left wall of a square cavity, cools the right wall, and insulates the horizontal walls. Circulation arises solely from the temperature difference, testing Boreas's Boussinesq buoyancy, temperature–velocity coupling, and heat conservation. Rayleigh numbers 10³, 10⁴, 10⁵, and 10⁶ span conduction-dominated to thin-boundary-layer convection. Results are from Boreas v0.10.0 on GPU. No CPU comparison was run for this set; a previous-version run of the same deck agreed at probes to five decimal places.
Model and boundary conditions
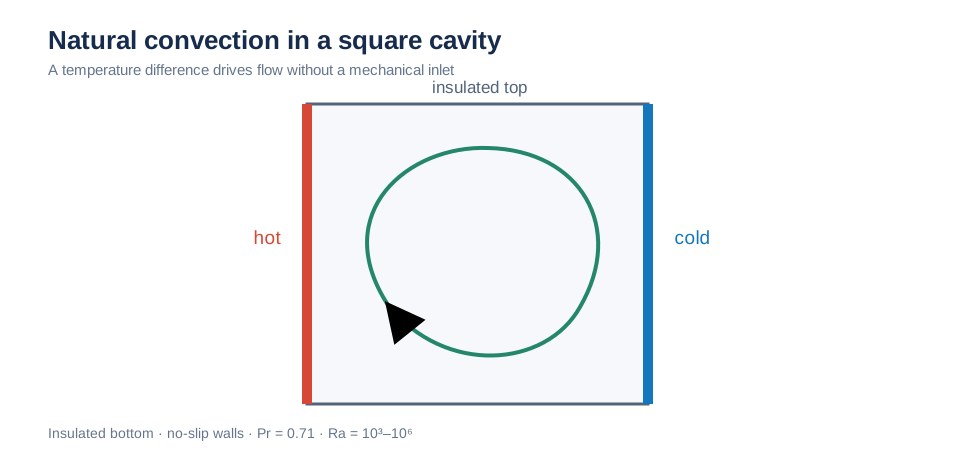
The square cavity has a hot left wall, cold right wall, and insulated top and bottom. The temperature difference alone drives circulation. Schematic; not to scale.
Benchmark
de Vahl Davis (1983) presents Richardson-extrapolated benchmark values in Table V. Length is scaled by L, velocity by α/L, and temperature by (T − T_c)/(T_h − T_c).
| Symbol | Meaning |
|---|---|
| u_max | Maximum horizontal velocity on the vertical centerline x = 0.5 and its height |
| w_max | Maximum vertical velocity on the horizontal centerline y = 0.5 and its location |
| ψ_mid | Absolute streamfunction at cavity center (center circulation) |
| Nu₀ | Mean Nusselt number at the hot wall |
| Nu½ | Mean Nusselt number through the vertical midplane x = 0.5; at steady state it must equal Nu₀ by heat conservation |
| Nu_max | Maximum local Nusselt number at the hot wall |
Simulation setup
| Item | Boreas setting |
|---|---|
| Cavity | Square of side L = 1; fixed isothermal left wall T_h = +0.5 and right wall T_c = −0.5; insulated stationary top and bottom |
| Scaling | ΔT = 1 and βg = 1, giving Ra = 1/(να) and Pr = ν/α = 0.71; ν and α set for Ra = 10³–10⁶ |
| Two dimensions | Three cells through thickness with symmetry on both faces |
| Mesh | Uniform N × N, N = 64, 128, 256, 512 for each Ra |
| Time | dt = 0.1 s; stop when mean-velocity change over 10 s is below 1e-4 × reference speed (t = 20–110 s) |
| Advection | First-order upwind and semi-Lagrangian, laminar; 32 runs total |
| Comparison | Mid-thickness cells; parabolic interpolation for u_max and w_max; wall heat flux for Nu₀; mean advective plus conductive heat flux across midplane for Nu½ |
Results
Upwind mesh convergence
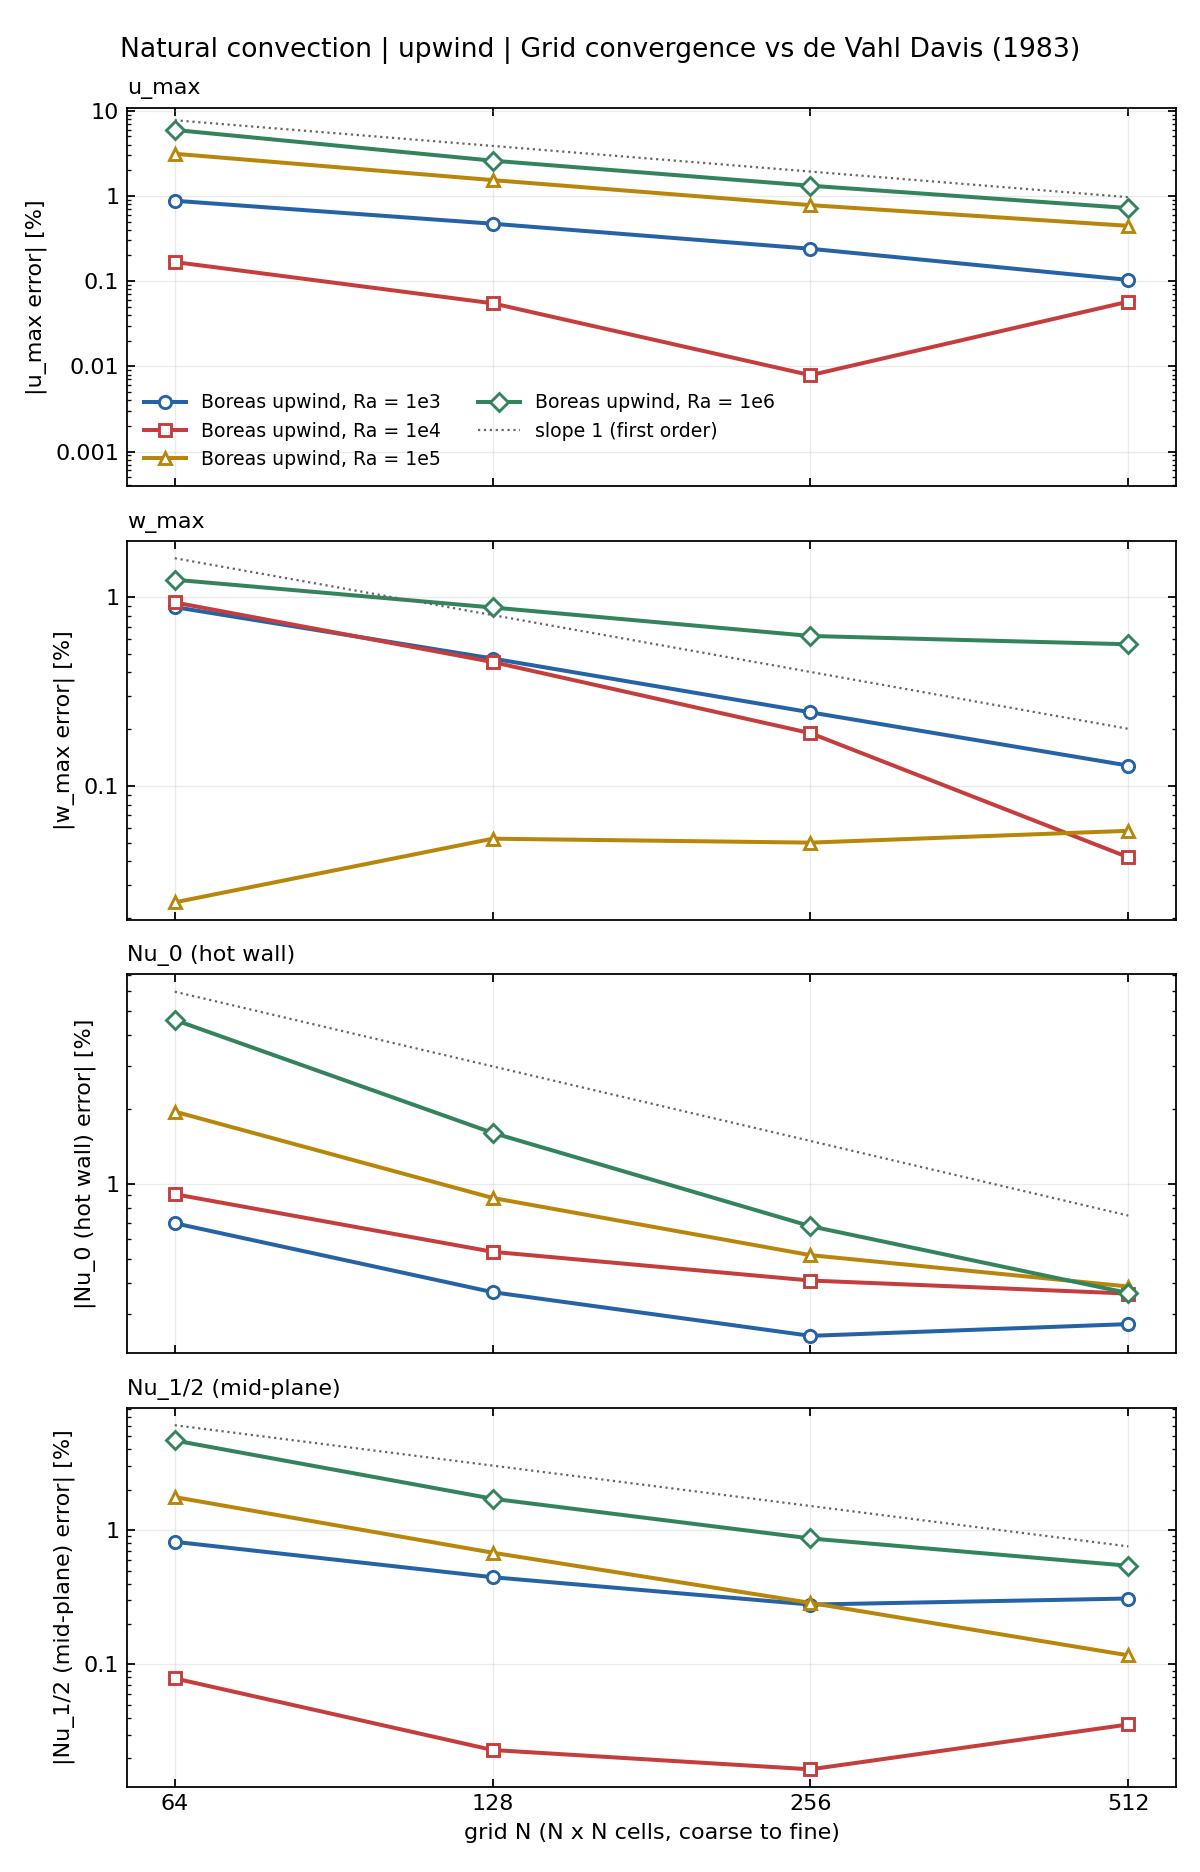
Absolute benchmark-relative errors in u_max, w_max, Nu₀, and Nu½ from top to bottom versus mesh N; dashed guides are first order. At Ra = 10⁵–10⁶ all four converge at first order. At Ra = 10³–10⁴, errors fall below 0.3% at 512² and approach benchmark tabulation precision.
Semi-Lagrangian mesh convergence
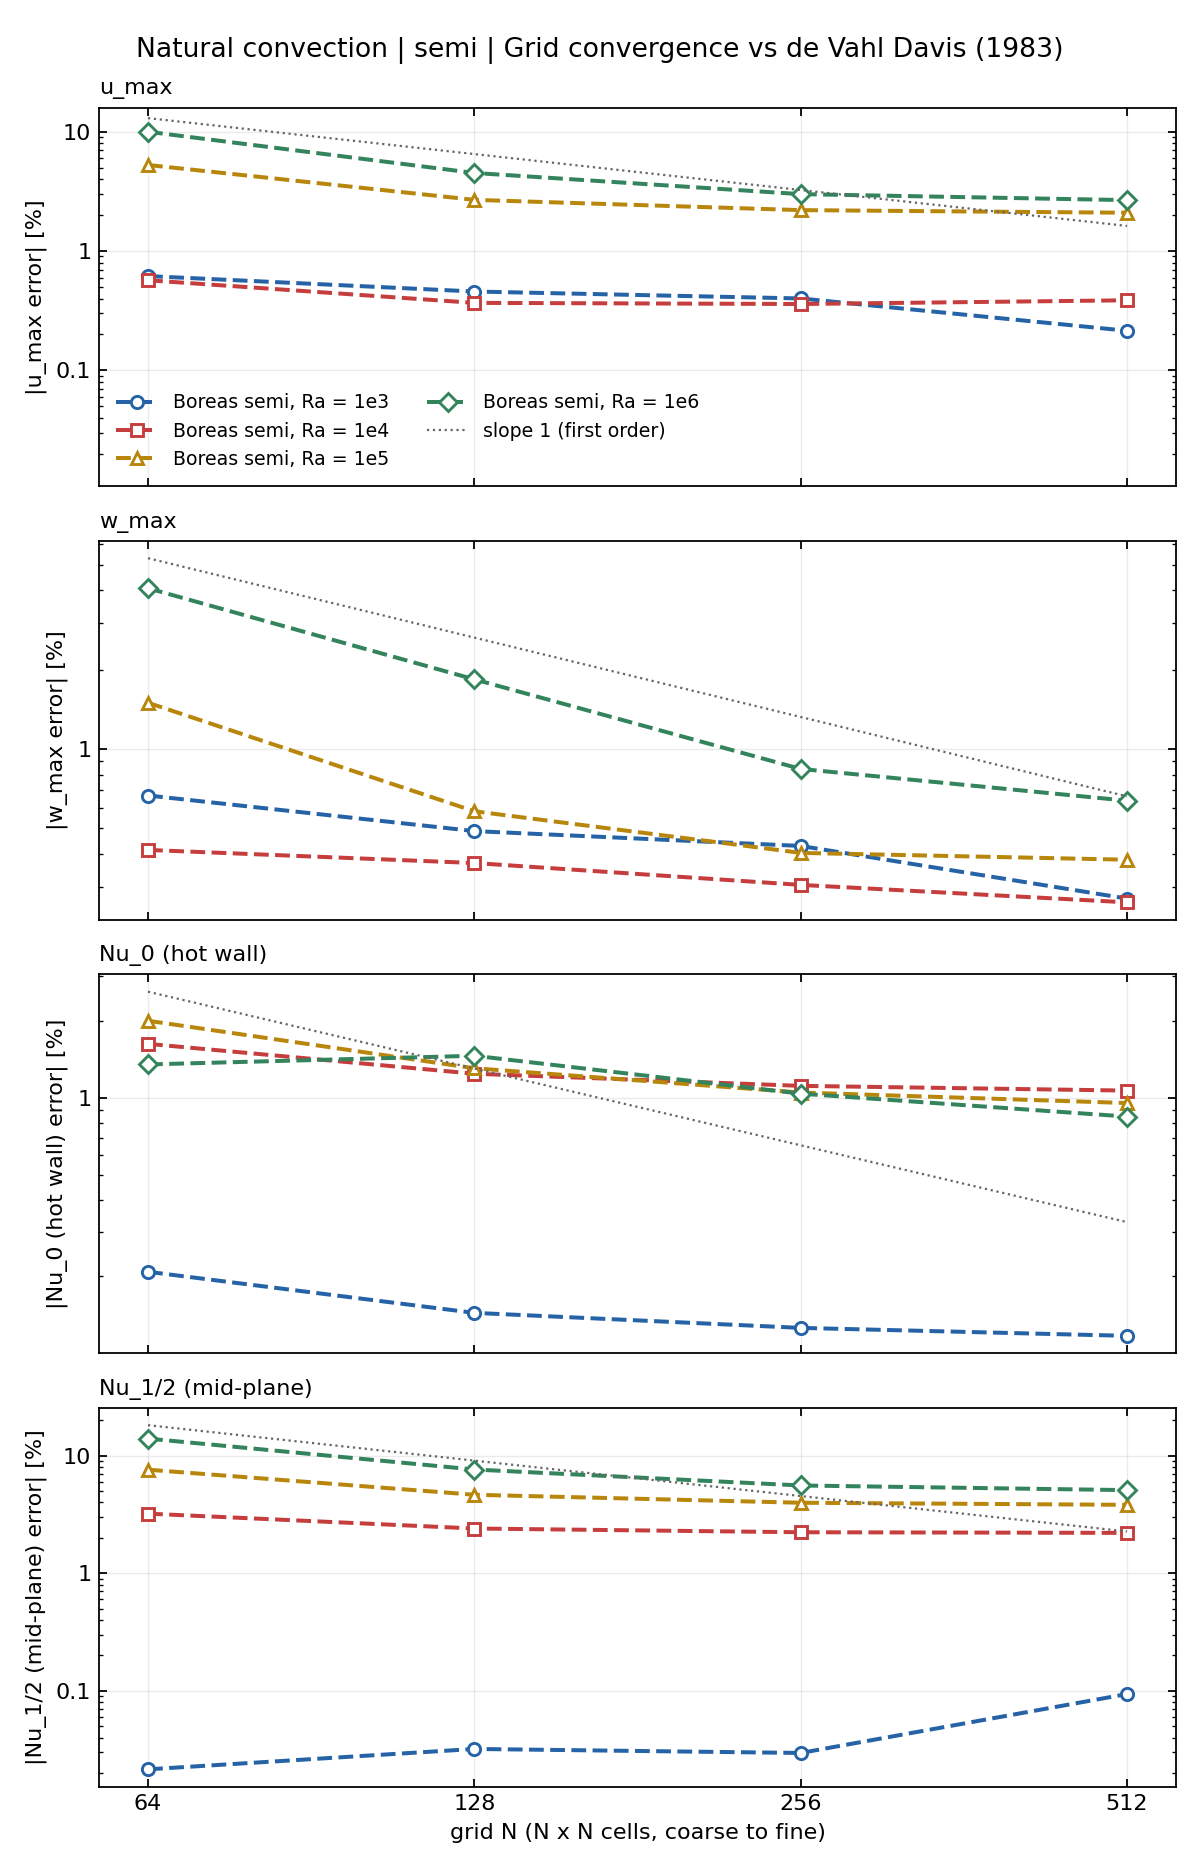
Velocity extrema improve under refinement, but for Ra ≥ 10⁴, Nu₀ stays around −1% and Nu½ around +2–5%. Their mismatch does not close with mesh refinement, indicating nonconservation of heat.
Centerline velocities at Ra = 10⁶
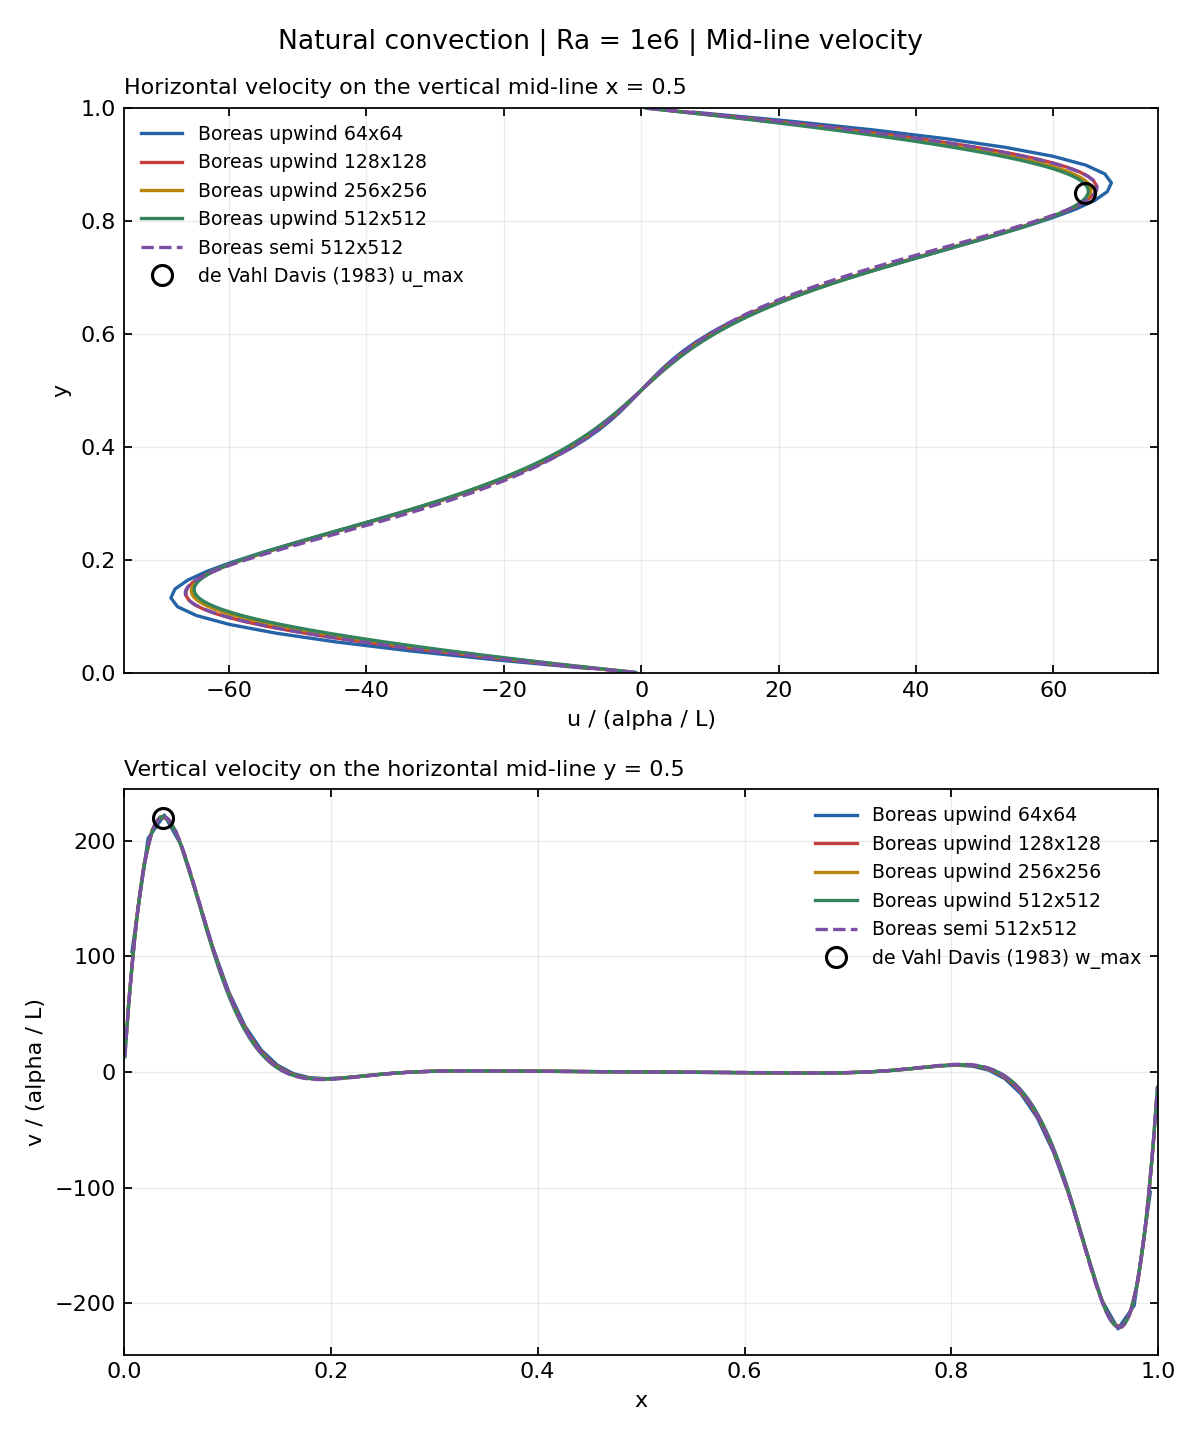
Horizontal velocity on x = 0.5 above; vertical velocity on y = 0.5 below. Upwind meshes from 64² to 512² approach the benchmark extrema (circles). Semi-Lagrangian at 512² has u_max about 2.7% high.
Temperature and flow fields
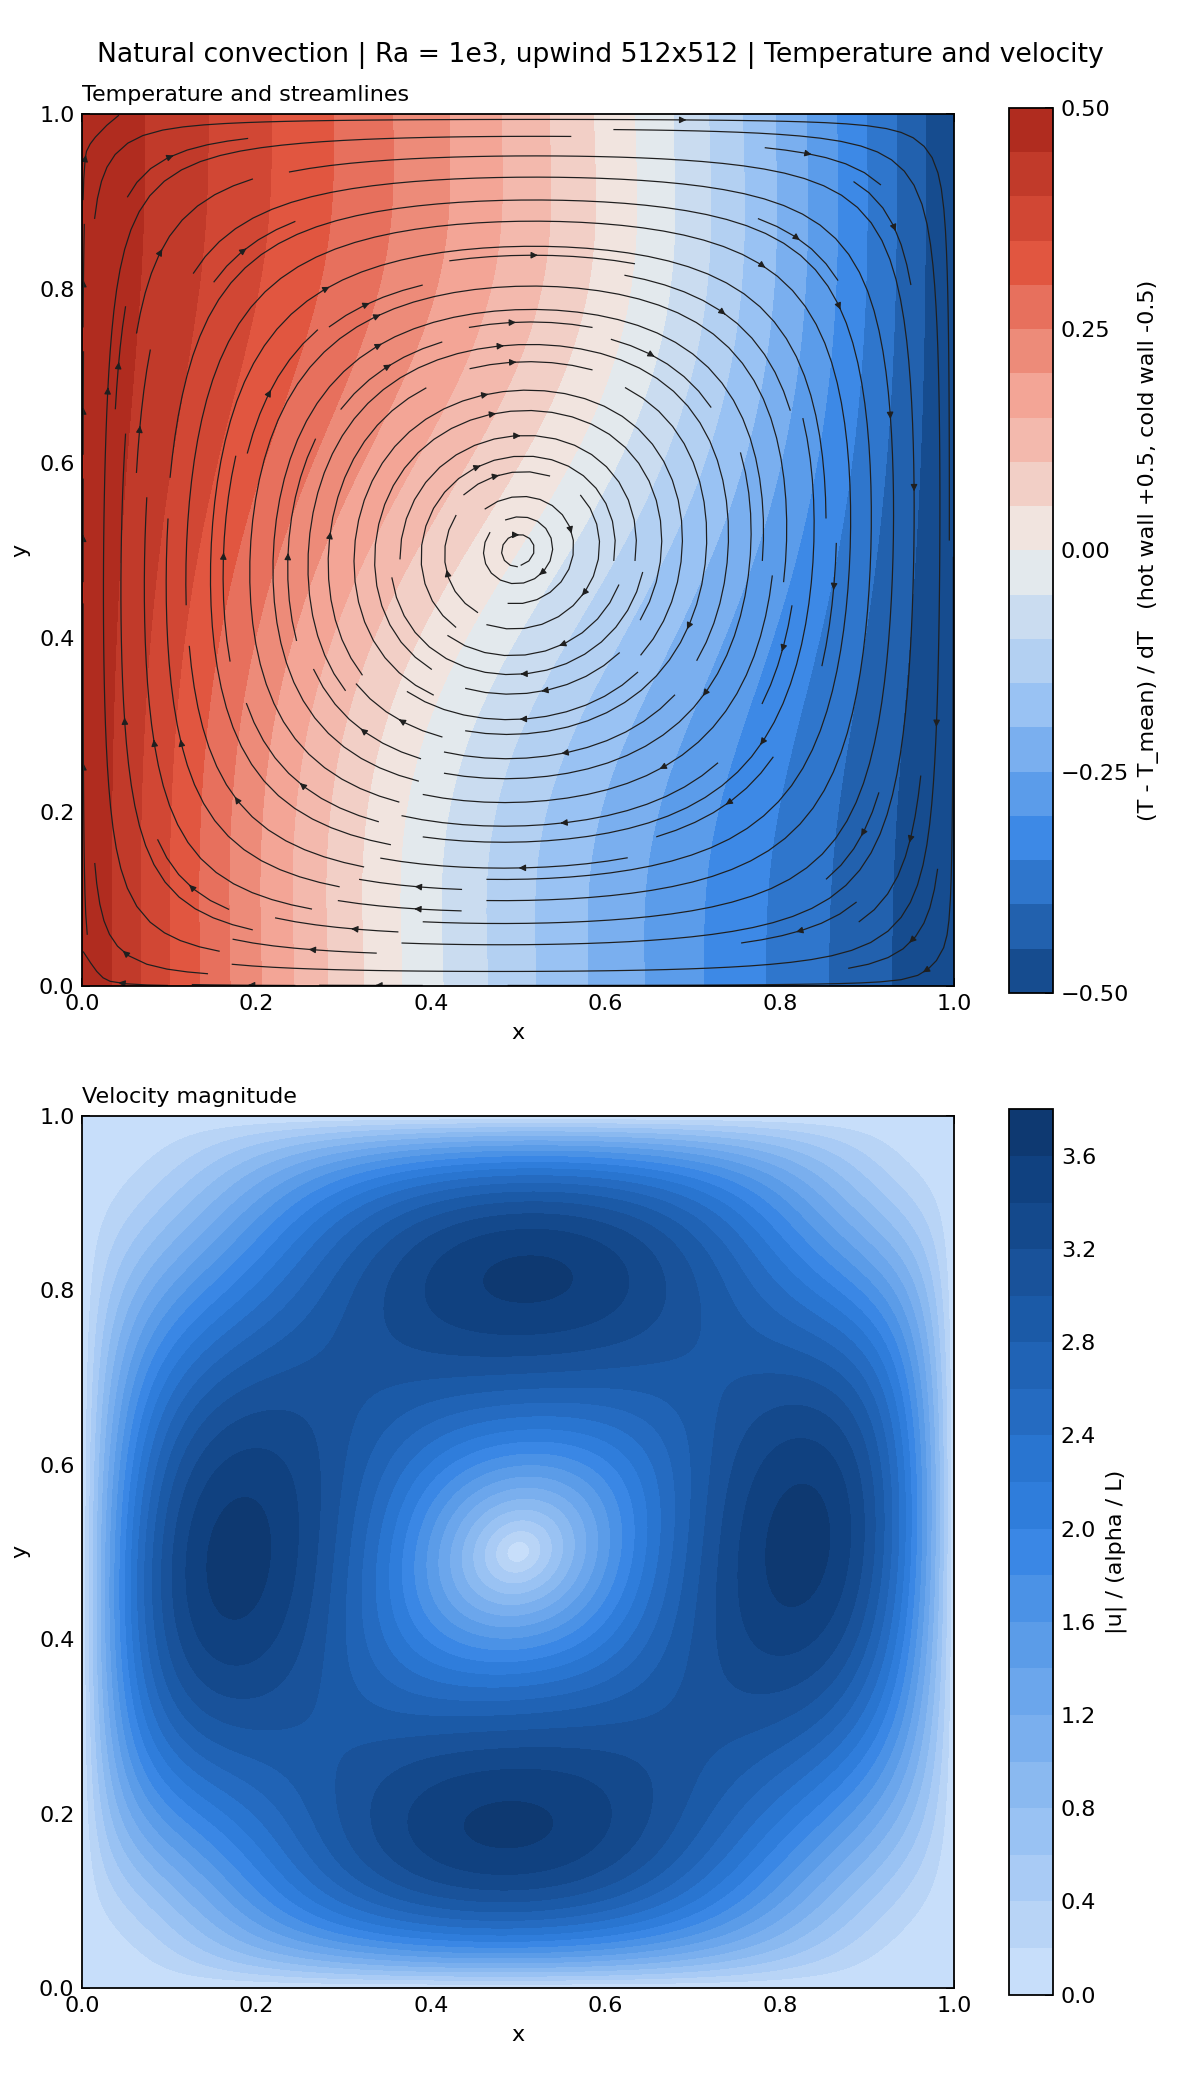
At Ra = 10³, buoyancy is weak, isotherms are nearly vertical, and heat transfer is predominantly conductive.
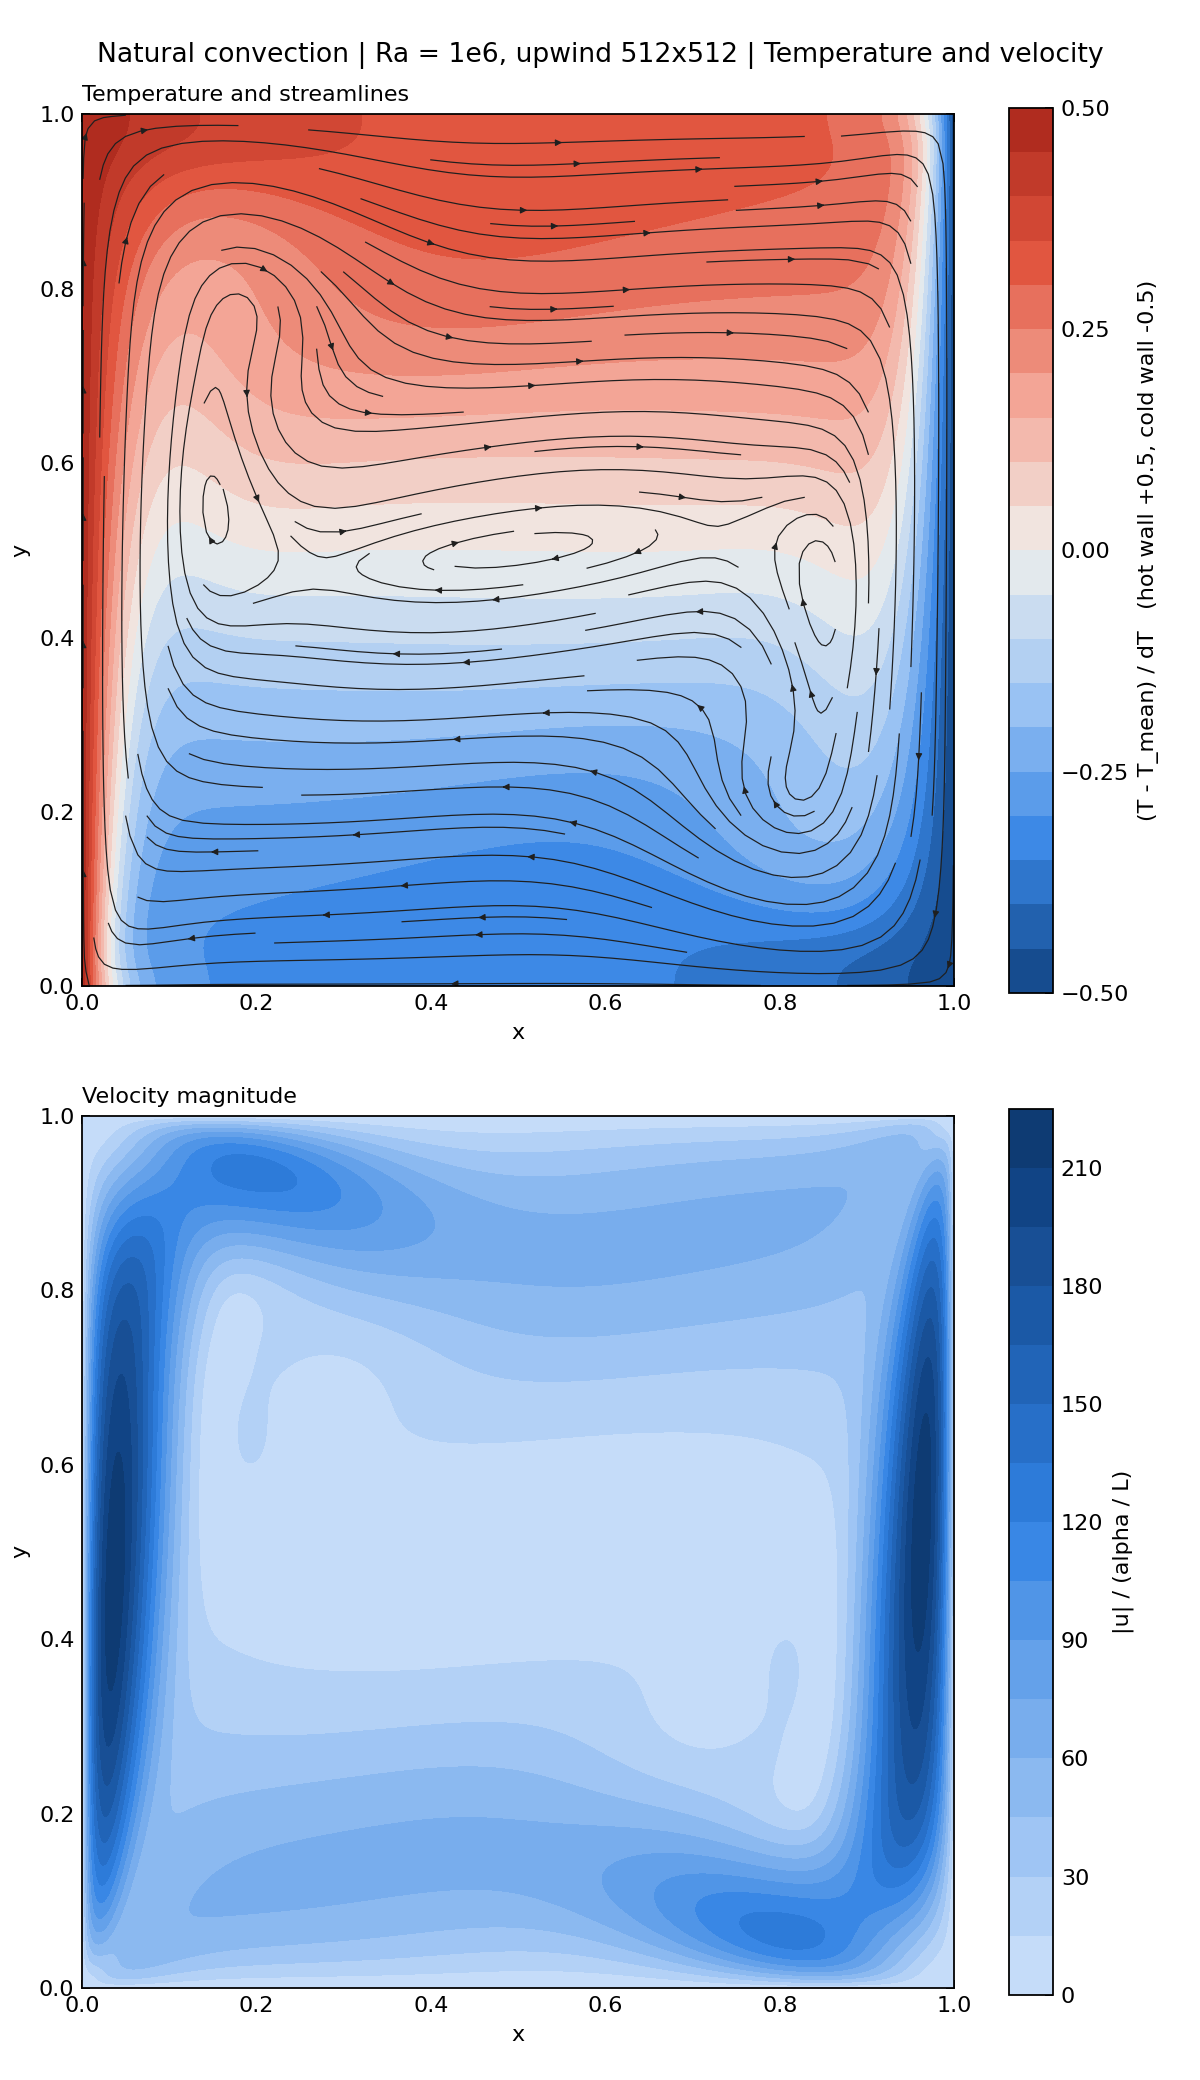
At Ra = 10⁶, the core is horizontally stratified, thin thermal and velocity boundary layers line the sidewalls, and secondary circulation appears beside the core, matching the structure in the benchmark's Figures 3–5.
Approach to steady state
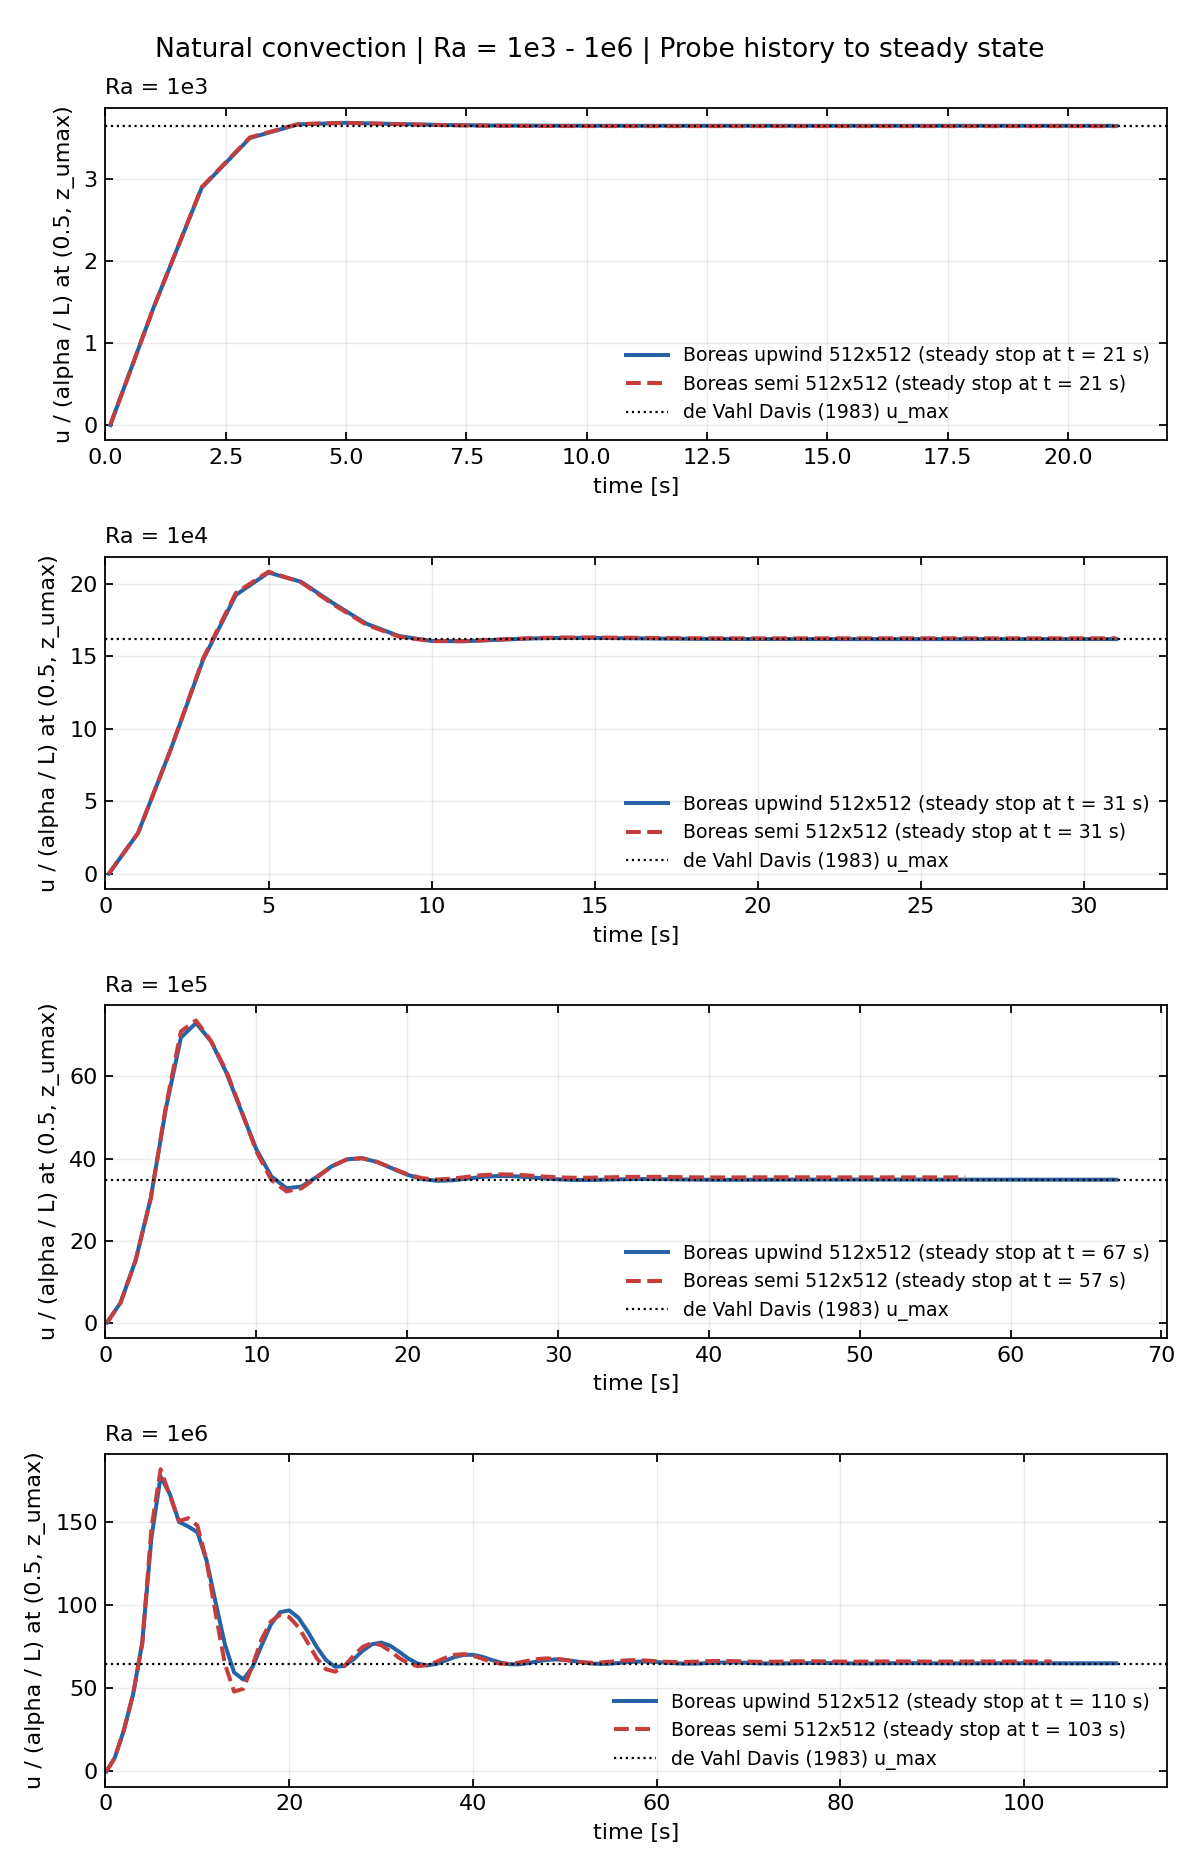
Horizontal velocity at the u_max location on 512² meshes, in α/L units. Dashed lines are benchmark extrema. All runs met the steady-state criterion; buoyancy oscillations last longer at higher Ra.
Quantitative results
The following errors at 512² are (Boreas − benchmark)/benchmark, using Table V.
Upwind, 512²
| Ra | u_max | w_max | ψ_mid | Nu₀ | Nu½ |
|---|---|---|---|---|---|
| 10³ | 3.645 (−0.1%) | 3.692 (−0.1%) | 1.173 (−0.1%) | 1.120 (+0.3%) | 1.115 (−0.3%) |
| 10⁴ | 16.19 (+0.1%) | 19.61 (−0.0%) | 5.077 (+0.1%) | 2.246 (+0.4%) | 2.242 (−0.0%) |
| 10⁵ | 34.88 (+0.4%) | 68.63 (+0.1%) | 9.158 (+0.5%) | 4.526 (+0.4%) | 4.524 (+0.1%) |
| 10⁶ | 65.10 (+0.7%) | 220.6 (+0.6%) | 16.46 (+0.8%) | 8.849 (+0.4%) | 8.847 (+0.5%) |
At Ra = 10⁶ the benchmark values are u_max 64.63, w_max 219.36, ψ_mid 16.32, Nu₀ 8.817, and Nu½ 8.799.
Upwind mesh convergence at Ra = 10⁶
| N | u_max error [%] | Nu₀ error [%] | Nu₀ error ratio, previous/current |
|---|---|---|---|
| 64 | +5.9 | +4.6 | — |
| 128 | +2.6 | +1.6 | 2.9 |
| 256 | +1.3 | +0.7 | 2.4 |
| 512 | +0.7 | +0.4 | 1.9 |
Errors approximately halve when N doubles, consistent with first-order upwind advection. On coarse meshes its numerical diffusion thickens the wall boundary layers.
Semi-Lagrangian, 512²
| Ra | u_max | w_max | Nu₀ | Nu½ |
|---|---|---|---|---|
| 10³ | 3.641 (−0.2%) | 3.687 (−0.3%) | 1.116 (−0.1%) | 1.119 (+0.1%) |
| 10⁴ | 16.24 (+0.4%) | 19.57 (−0.3%) | 2.214 (−1.1%) | 2.292 (+2.2%) |
| 10⁵ | 35.46 (+2.1%) | 68.85 (+0.4%) | 4.466 (−1.0%) | 4.691 (+3.8%) |
| 10⁶ | 66.36 (+2.7%) | 220.8 (+0.6%) | 8.742 (−0.8%) | 9.246 (+5.1%) |
Interpretation and limits
- Heat conservation: At steady state, heat crossing every vertical section must match, so Nu₀ = Nu½. Conservative upwind gives values matching to three decimal places. Semi-Lagrangian has Nu½ 2–6% above Nu₀ even after refinement. Use upwind for heat-transfer or heat-source calculations; semi-Lagrangian is better suited to velocity-focused cases here.
- Upwind is first order and diffusive on coarse meshes (Nu₀ +4.6% at Ra = 10⁶ on 64²). At Ra = 10⁶, 128² or finer is needed to bring the error within 2%.
- Benchmark extrema use fourth-order polynomial interpolation, while Boreas uses parabolic interpolation of cell values. Differences near 0.1% at 512² are within interpolation and tabulation limits.
- These runs used GPU only. CPU–GPU agreement was checked for an earlier-version run of the same Ra = 10³, 64² deck; regression tests run both.
Reference
- de Vahl Davis, G. (1983). “Natural convection of air in a square cavity: a bench mark numerical solution.” International Journal for Numerical Methods in Fluids, 3(3), 249–264. DOI: 10.1002/fld.1650030305.