
We compare Boreas with the enclosed-room airflow experiment of Wang and Chen (2009), conducted for ASHRAE RP-1271. A ceiling-side slot supplies air to a 2.44 m cubical room, and a floor-side slot on the opposite wall exhausts it. The supply-slot Reynolds number is approximately 2,600, in the transitional regime. We compare measured vertical velocity and temperature profiles for an empty-room forced-convection case (Case 1) and a heated-box mixed-convection case (Case 3). These are Boreas v0.10.0 GPU results; the same decks have not yet been run on CPU.
Model and boundary conditions
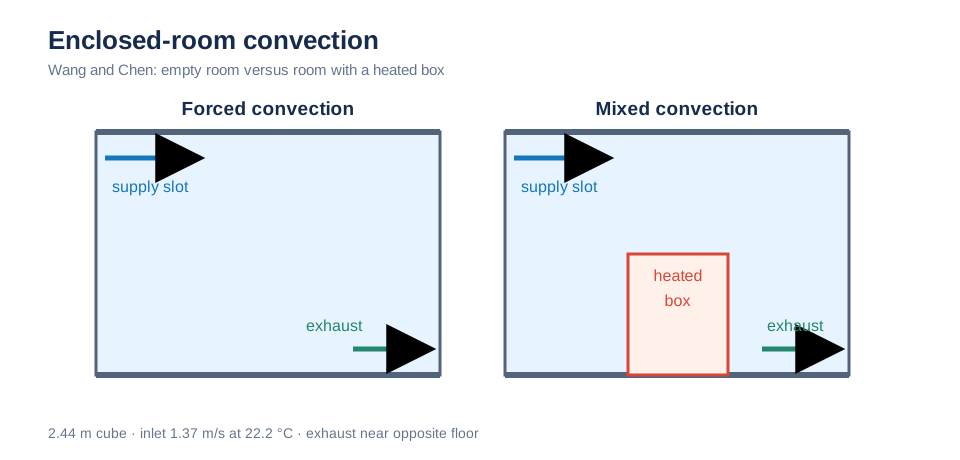
Both cases supply air through a high wall slot and exhaust through a low slot on the opposite wall. The mixed-convection case adds a heated box on the floor. Schematic; not to scale.
Experiment
| Item | Wang and Chen (2009) |
|---|---|
| Room | 2.44 × 2.44 × 2.44 m cube, representing a simplified aircraft cabin section |
| Supply | Full-width × 0.03 m slot immediately below the ceiling on x = 0 wall; 1.37 m/s at 22.2 °C (0.10 m³/s) |
| Exhaust | Full-width × 0.08 m slot at the floor on x = 2.44 m wall |
| Case 1, forced convection | Empty, isothermal room |
| Case 3, mixed convection | 1.22 m cubical heated box on room-center floor (700 W, surface 36.7 °C); measured wall temperatures: ceiling 25.8 °C, floor 26.9 °C, sidewalls 27.4 °C |
| Measurements | Ultrasonic anemometer (speed) and thermocouples at vertical lines P1 (x 0.23, y 1.22 m), P3 (1.14, 1.22), P5 (2.06, 1.22), and P6 (1.22, 0.23), each with 16 heights (z/L 0.03–0.97) |
| Scaling | L = 2.44 m, U_max = 1.5 m/s, T* = (T − 22.2)/(36.7 − 22.2) |
Measurements were digitized from published figures (reading uncertainty ±0.005). Forced-convection P5 and P6 agree point by point with Figure 8 of Wang and Chen. Forced P1/P3 and mixed-convection profiles were digitized from figures used in an earlier public version, derived from Wang's original data or via Han et al. (2021), because those measurement lines are not shown in the main paper. Mixed-convection P3 exists only above the box (z/L > 0.5). Thus there are 64 forced and 56 mixed measurement points.
Simulation setup
| Item | Boreas setting |
|---|---|
| Domain | Same 2.44 m cube as the experiment |
| Supply and exhaust | Uniform normal inlet velocity 1.37 m/s at 22.2 °C; pressure-outlet exhaust slot |
| Heated box | 1.22 m solid cube on floor, prescribed surface temperature 36.7 °C rather than prescribed heat output |
| Mixed-case walls | Ceiling 25.8 °C, floor 26.9 °C, sidewalls 27.4 °C, all isothermal; supply/exhaust walls assumed insulated |
| Air and buoyancy | ν = 1.5e-5 and α = 2.2e-5 m²/s; Boussinesq β = 0.0034 K⁻¹ referenced to 22.2 °C |
| Turbulence | Chen zero-equation model |
| Advection | First-order upwind (primary) and semi-Lagrangian |
| Mesh | Octree base cells h0 = 0.122 and 0.061 m; one level of refinement within 0.25 m of walls and two within 0.09 m (smallest cells 3 and 1.5 cm). Forced: 99,000 and 1.03 million cells; mixed: 138,000 and 1.44 million cells |
| Time | dt = 0.2 s; forced 600 s, averaged over 300–600 s; mixed 1000 s, averaged over 500–1000 s |
| Comparison | Interpolate time-averaged cell columns to measurement heights; MAE and bias (Boreas − measurement) of |
Results
Circles show measurements. The blue solid line is upwind at h0 = 0.061 m, the primary result. The red dashed line is upwind on the coarser h0 = 0.122 m mesh; the ochre dashed line is semi-Lagrangian at h0 = 0.061 m.
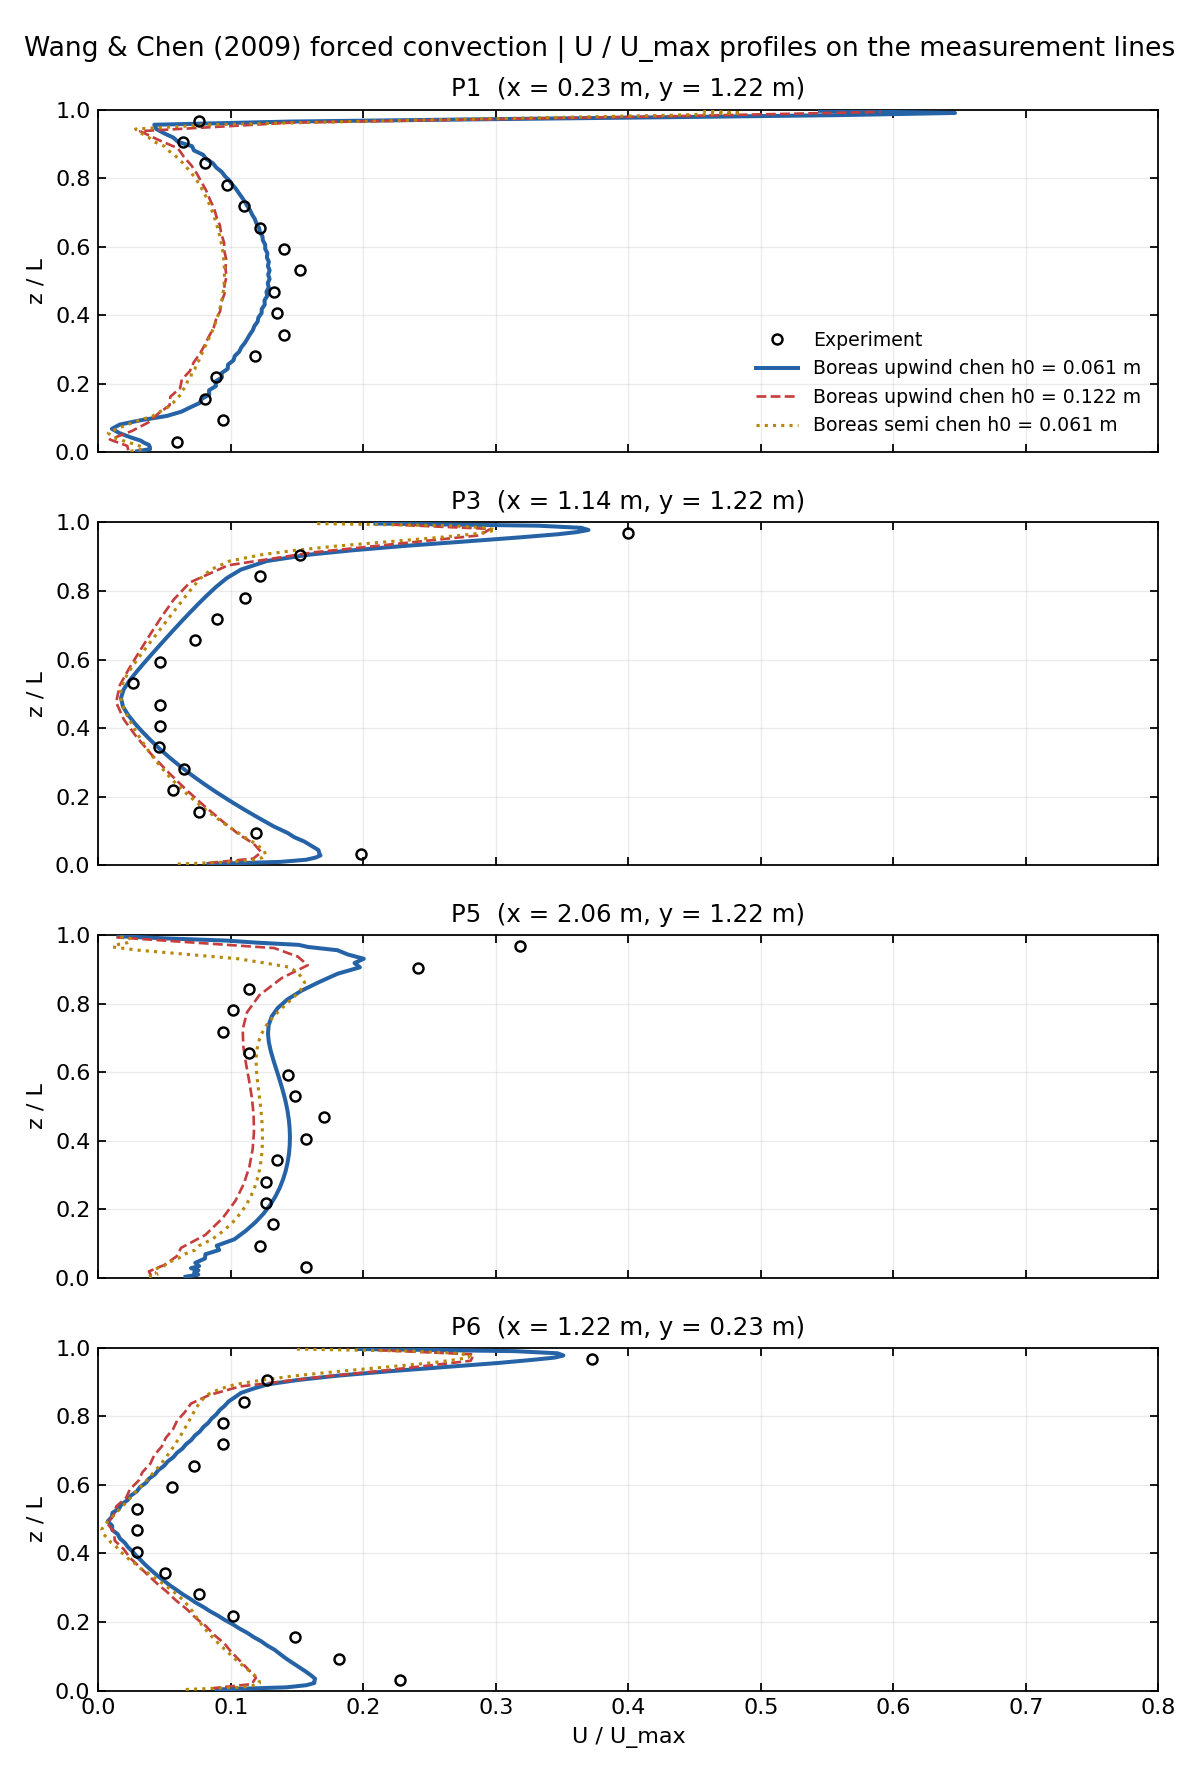
Case 1 speed. All four lines capture the ceiling jet (z/L > 0.9) and recirculation below (z/L 0.2–0.8). Differences remain just below the jet at P3/P5, where 1.5–3 cm near-wall cells barely resolve the 0.03 m slot, and near the floor at P5/P6, where predicted speed is low.
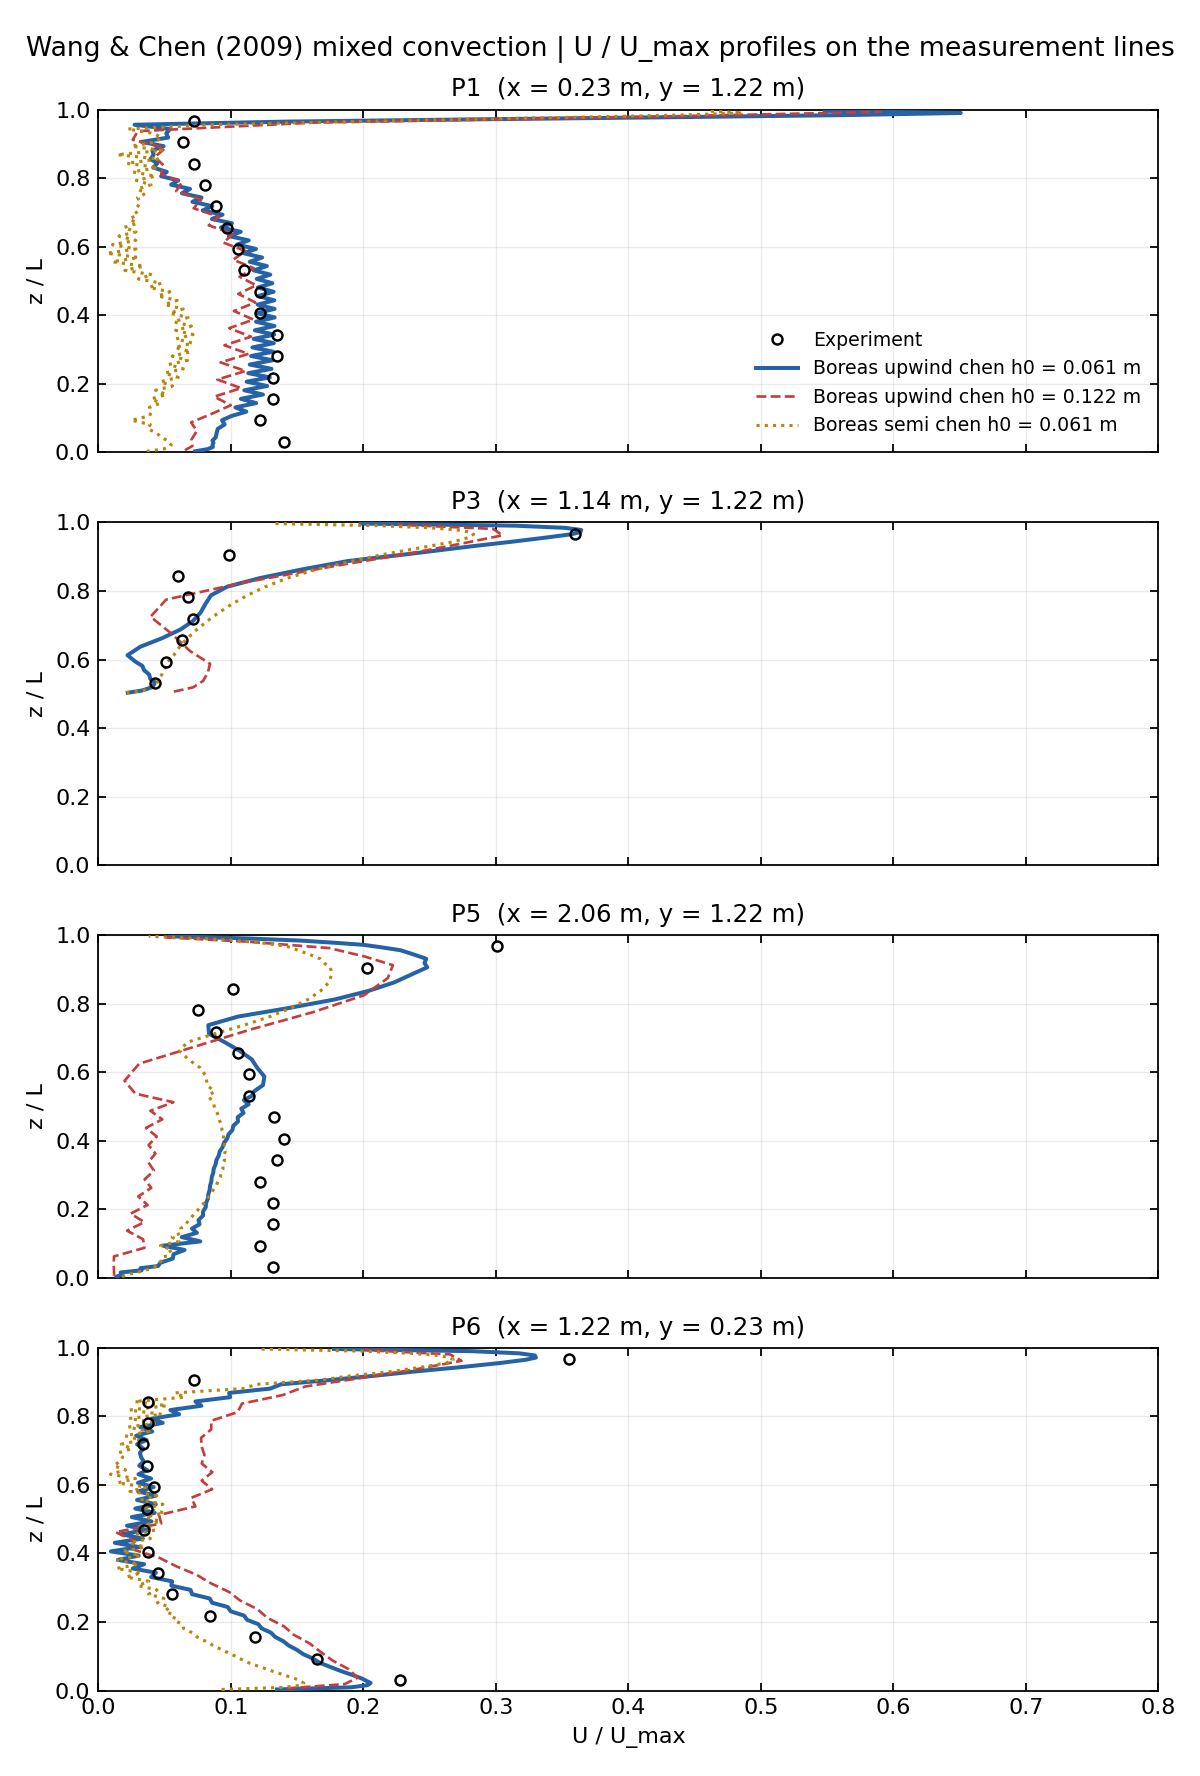
Case 3 speed. P3 includes only locations above the box (z/L > 0.5). Refinement improves agreement with measurements.
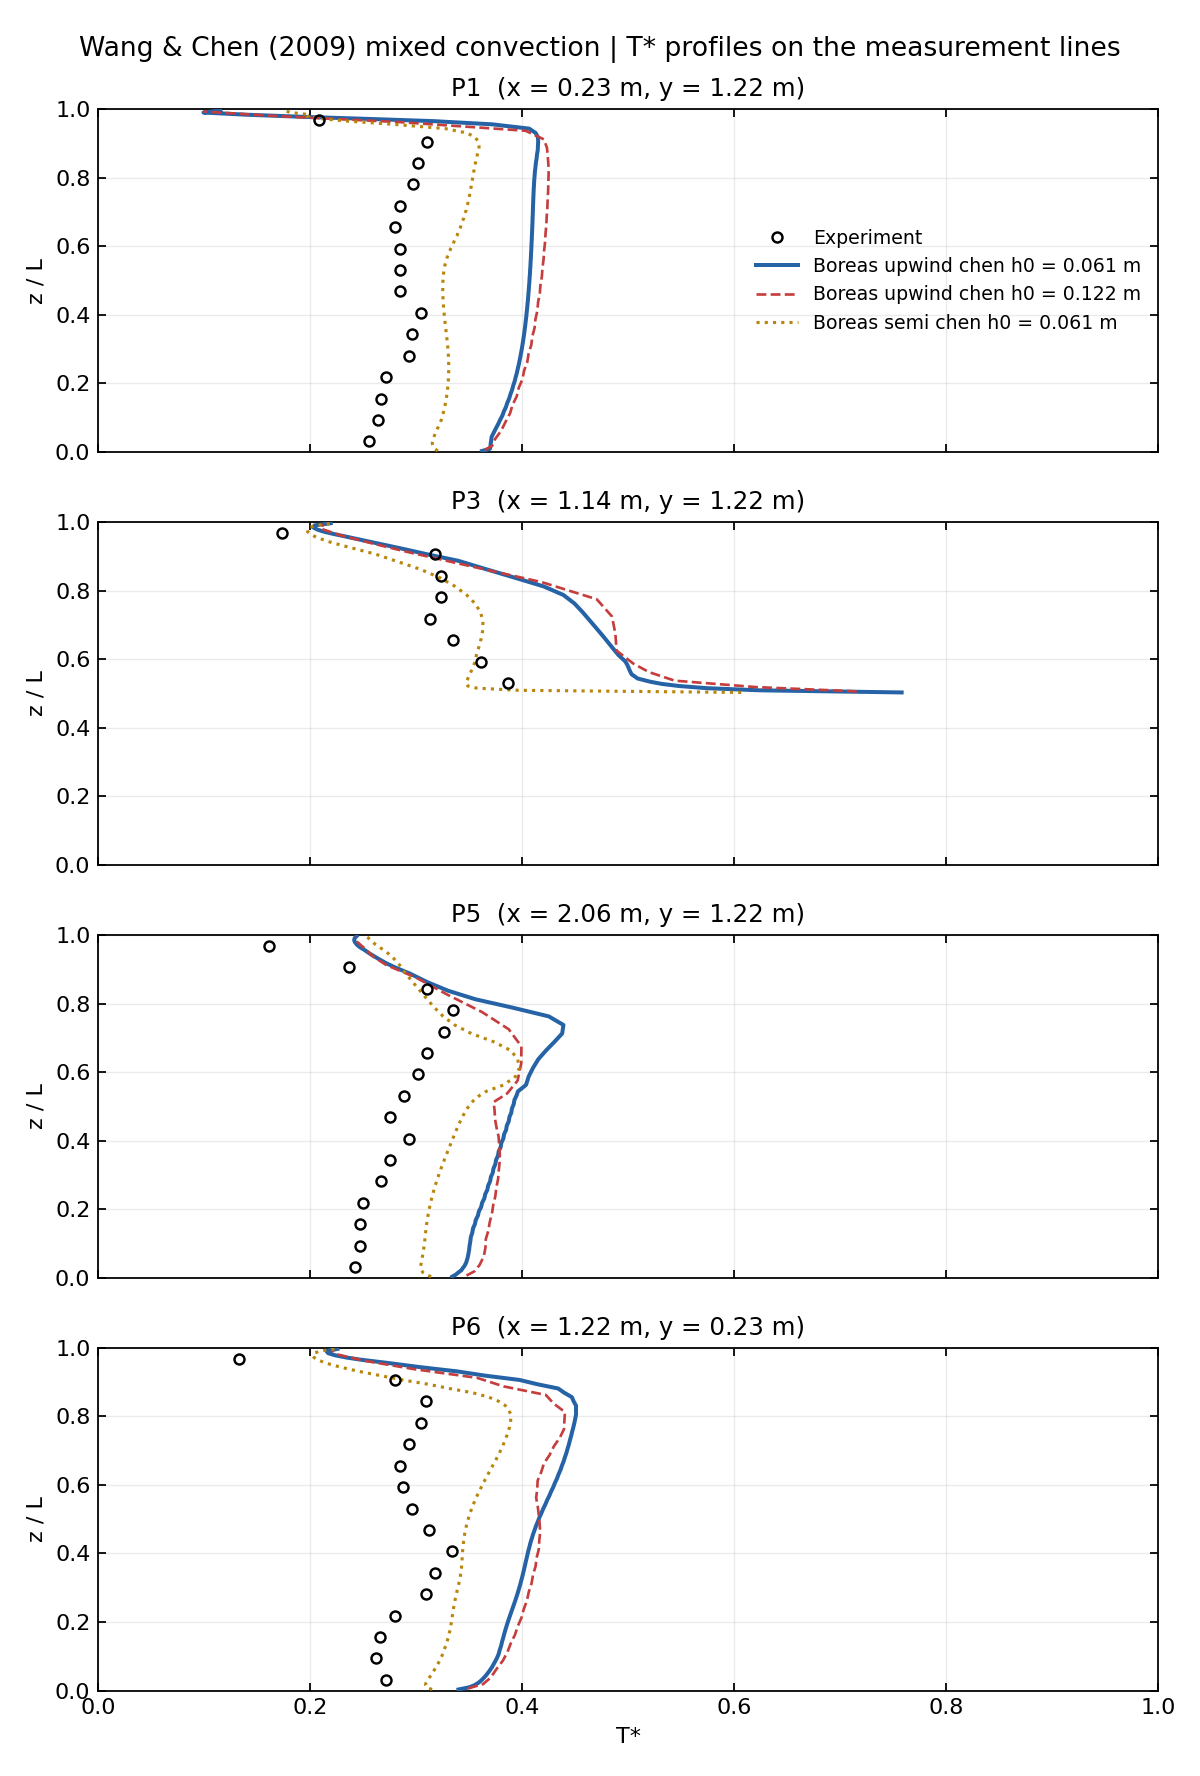
The T profile shape captures cool supply near the ceiling and a warm layer above the box, but upwind is about +0.1 T* (1.5 K) high on all four lines. Semi-Lagrangian looks closer to measured temperature but is not used as accuracy evidence because its heat balance does not close.*
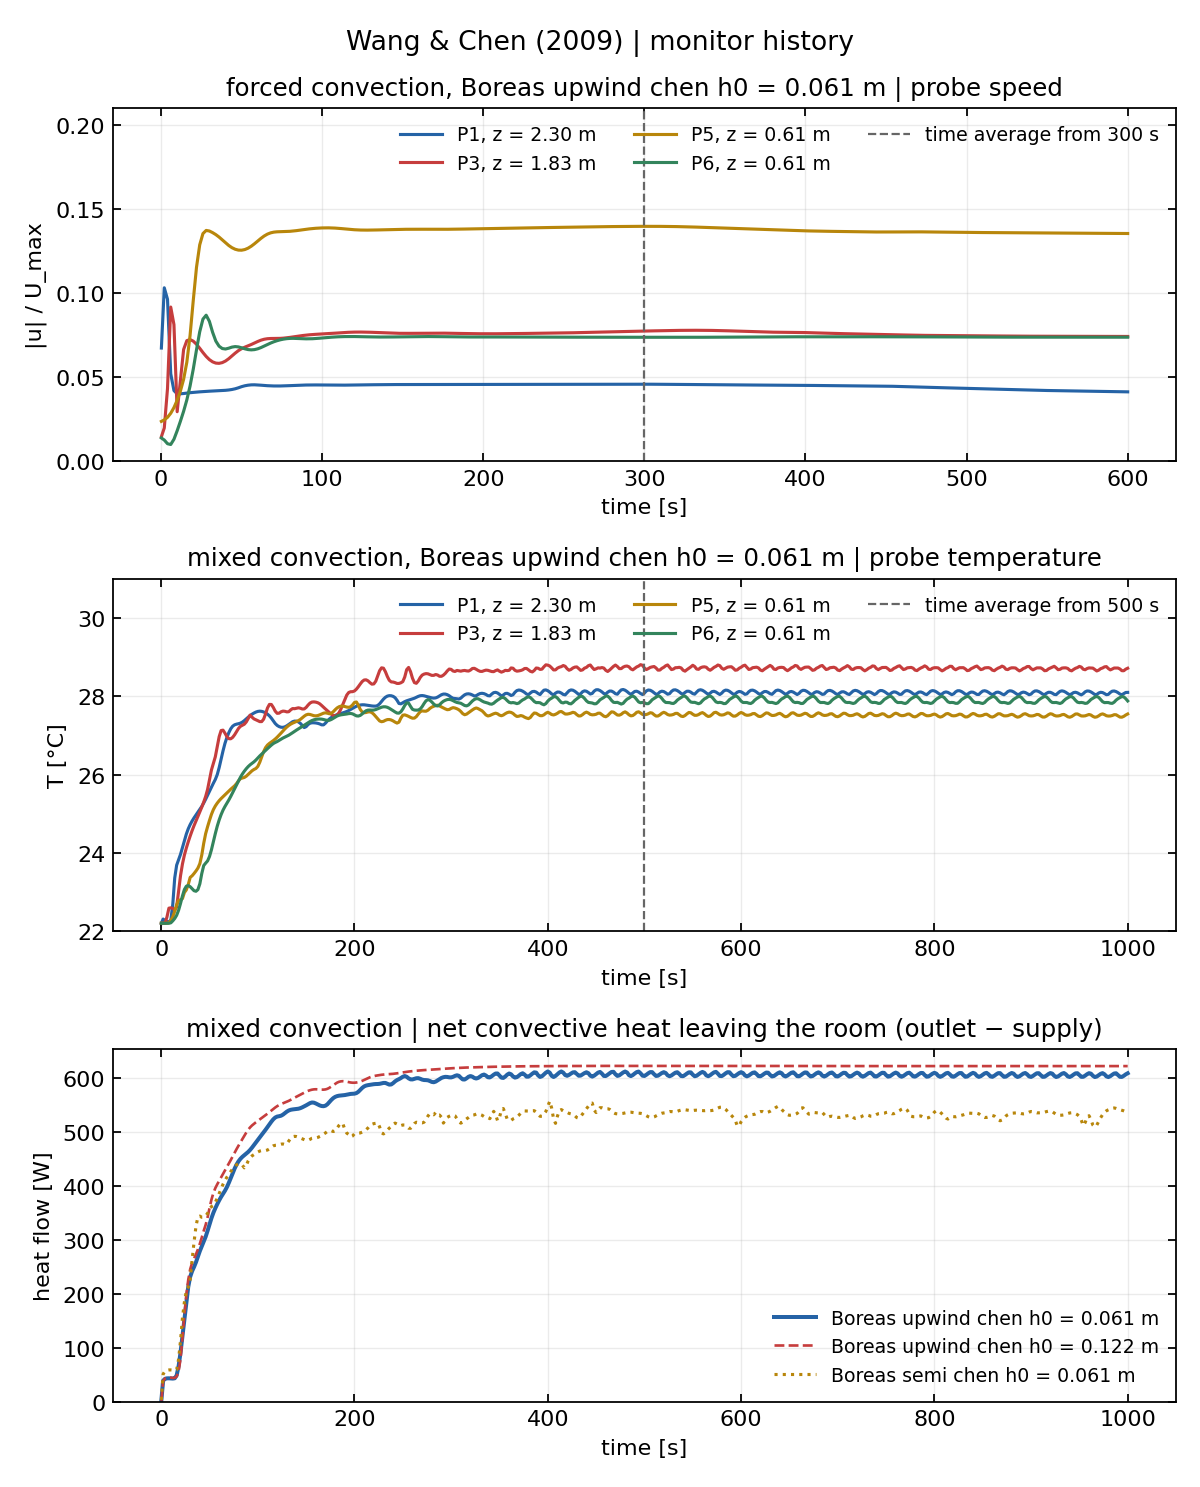
Forced-case probe speeds above, mixed-case probe temperatures in the middle, and mixed-case room net heat leaving (exhaust − supply) below. Dashed lines mark averaging starts; all monitored quantities settle beforehand.
Quantitative results
MAE and bias are in scaled units (U/U_max or T*); positive bias means Boreas is higher than the measurement.
| Case and variable (points) | Upwind h0 0.061 m | Upwind h0 0.122 m | Semi h0 0.061 m | Semi h0 0.122 m |
|---|---|---|---|---|
| Forced U (64) | MAE 0.025, bias −0.012 | 0.041, −0.033 | 0.042, −0.033 | 0.064, −0.059 |
| Mixed U (56) | MAE 0.031, bias −0.002 | 0.053, −0.009 | 0.052, −0.028 | 0.062, −0.029 |
| Mixed T* (56) | MAE 0.106, bias +0.106 | 0.108, +0.107 | 0.049, +0.045 | 0.061, +0.056 |
For upwind h0 = 0.061 m, line-specific MAEs are forced U: P1 0.021, P3 0.021, P5 0.034, P6 0.023; mixed U: 0.024, 0.033, 0.047, 0.020; and mixed T*: 0.114, 0.100, 0.092, 0.116. Refining from h0 = 0.122 to 0.061 m lowers speed MAE (upwind 0.041 → 0.025, semi 0.064 → 0.042). Mixed temperature bias stays near +0.107/+0.106, so that difference is not a mesh error.
| Mixed-convection heat balance | Net room heat leaving (exhaust − supply) | Mean room temperature |
|---|---|---|
| Boreas upwind h0 = 0.061 m | 608 W | 27.96 °C |
| Boreas upwind h0 = 0.122 m | 623 W | 28.05 °C |
| Experiment, estimated from measured temperatures | About 500 W | About 26.3 °C (T* ≈ 0.28) |
The experimental room is about 4 K warmer than supply, corresponding to roughly 500 W carried by 0.10 m³/s of air. Approximately 200 W of the box's 700 W therefore leaves through the cooler walls. In Boreas upwind, wall heat loss is about 100 W lower, leaving the room about 1.5 K warmer.
Limits
- The mixed-case temperature level is uniformly about +1.5 K high. The cause of the wall-heat-transfer difference is unresolved; possible contributors include chen near-wall thermal diffusion, wall mesh, insulated supply/exhaust-wall assumptions, and prescribing box surface temperature instead of heat output.
- Semi-Lagrangian is excluded as temperature evidence: its nonconservative heat transport gives a fluctuating 533 W net room heat flow. Its speed-profile errors also exceed upwind.
- Only GPU runs were made. The two mesh levels show speed improvement, but dt = 0.2 s and the averaging windows were not varied.
- Except for forced P5/P6, measurement profiles were digitized from earlier public figures rather than the main paper.
- Uniform slot velocity, isothermal box and walls, and one chen turbulence model simplify the experiment.
References
- Wang, M. and Chen, Q. (2009). “Assessment of Various Turbulence Models for Transitional Flows in an Enclosed Environment (RP-1271).” HVAC&R Research, 15(6), 1099–1119. DOI: 10.1080/10789669.2009.10390881.
- Han, X., Tian, W., VanGilder, J., Zuo, W., and Faulkner, C. (2021). “An Open Source Fast Fluid Dynamics Model for Data Center Thermal Management.” Energy and Buildings, 230, 110599. DOI: 10.1016/j.enbuild.2020.110599.