
In startup Couette flow, fluid initially at rest between two plates is driven when the upper plate starts moving at speed U at t = 0. Because the flow is independent of the streamwise direction, advection vanishes and momentum reduces to one-dimensional diffusion with a series solution. This directly checks Boreas's diffusion solver, moving-wall condition, and temporal and spatial discretization. The results shown are from Boreas v0.10.0 on CPU; two decks were also run on GPU for comparison.
Model and boundary conditions
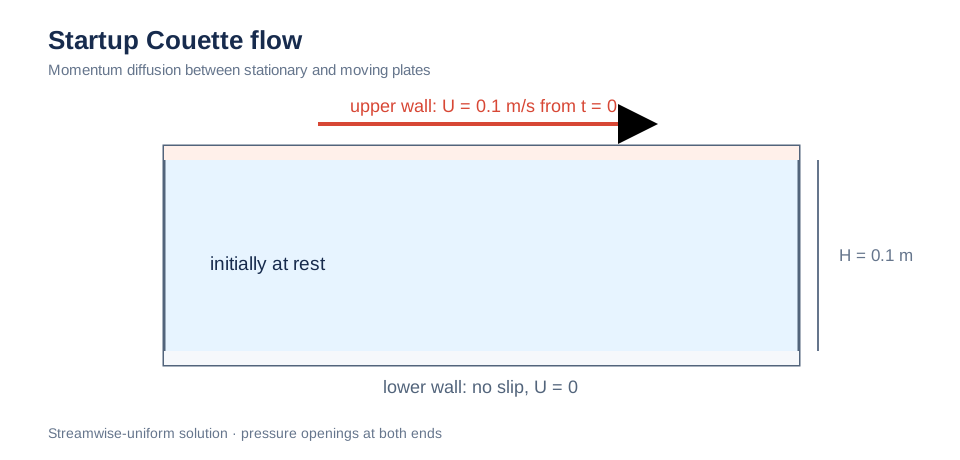
The upper wall begins moving at 0.1 m/s above initially stationary fluid; the lower wall remains fixed. Plate spacing is 0.1 m. Schematic; not to scale.
Analytical solution
For a channel with only the upper wall moving, ∂u/∂t = ν ∂²u/∂y², with u(0) = 0, u(H) = U, and initially u(y, 0) = 0:
As t → ∞, the exponential terms vanish and the profile becomes the steady linear solution u = Uy/H.
Simulation setup
| Item | Boreas setting |
|---|---|
| Channel | Height H = 0.1 m; stationary lower wall; upper wall moves at U = 0.1 m/s from t = 0 |
| Fluid | ν = 1e-3 m²/s (Re = UH/ν = 10); diffusion time H²/ν = 10 s |
| Mesh | Uniform h = H/N, with N = 8, 16, 32, and 64 |
| Time | dt = 0.001–0.1 s; 30 s total (three diffusion times) |
| Advection | Semi-Lagrangian and upwind; both give the same result because advection is zero |
| Comparison | Center-column cell velocities against the series solution at the same positions at t = 0.5, 1, 2, 5, and 29.9 s; error reported as RMS/U |
Velocity profiles
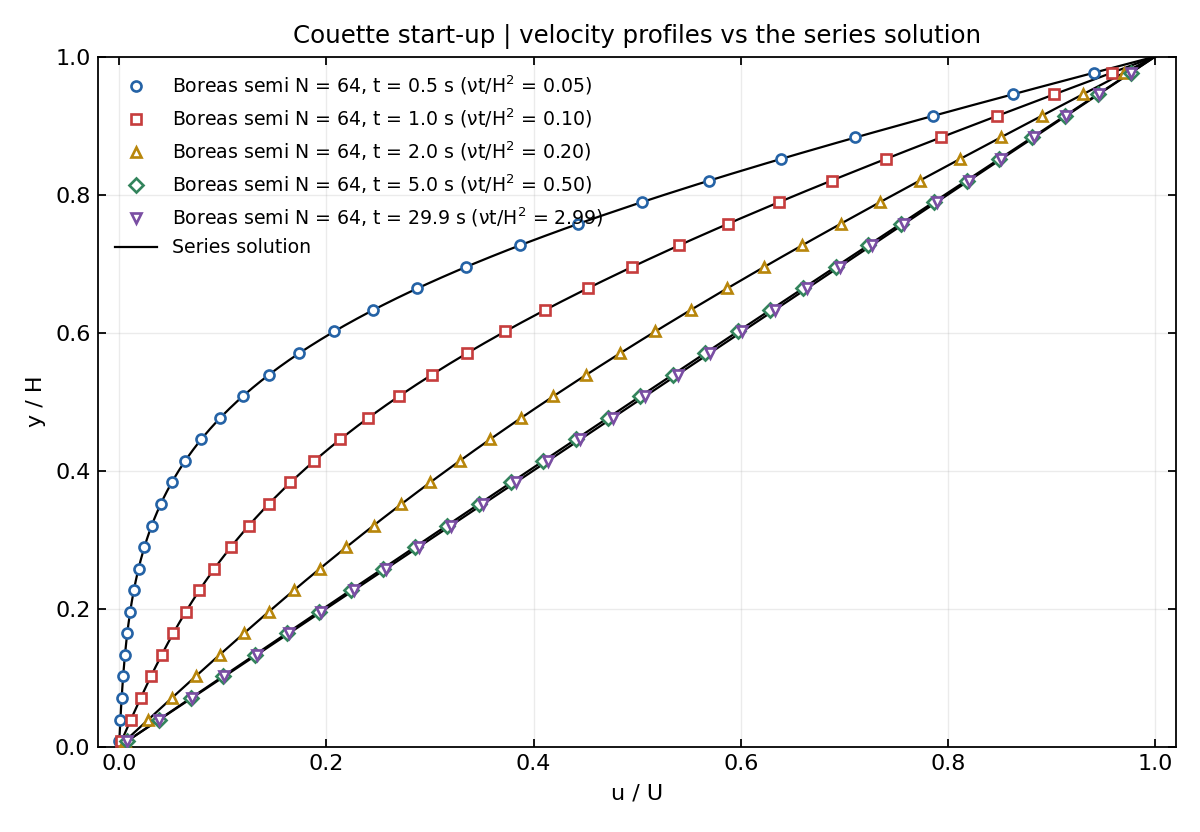
N = 64, dt = 0.001 s. Markers are Boreas cell values (every other cell); solid lines are the series solution. They overlap from the S-shaped profile at νt/H² = 0.05 to the steady linear profile at t = 29.9 s.
Convergence
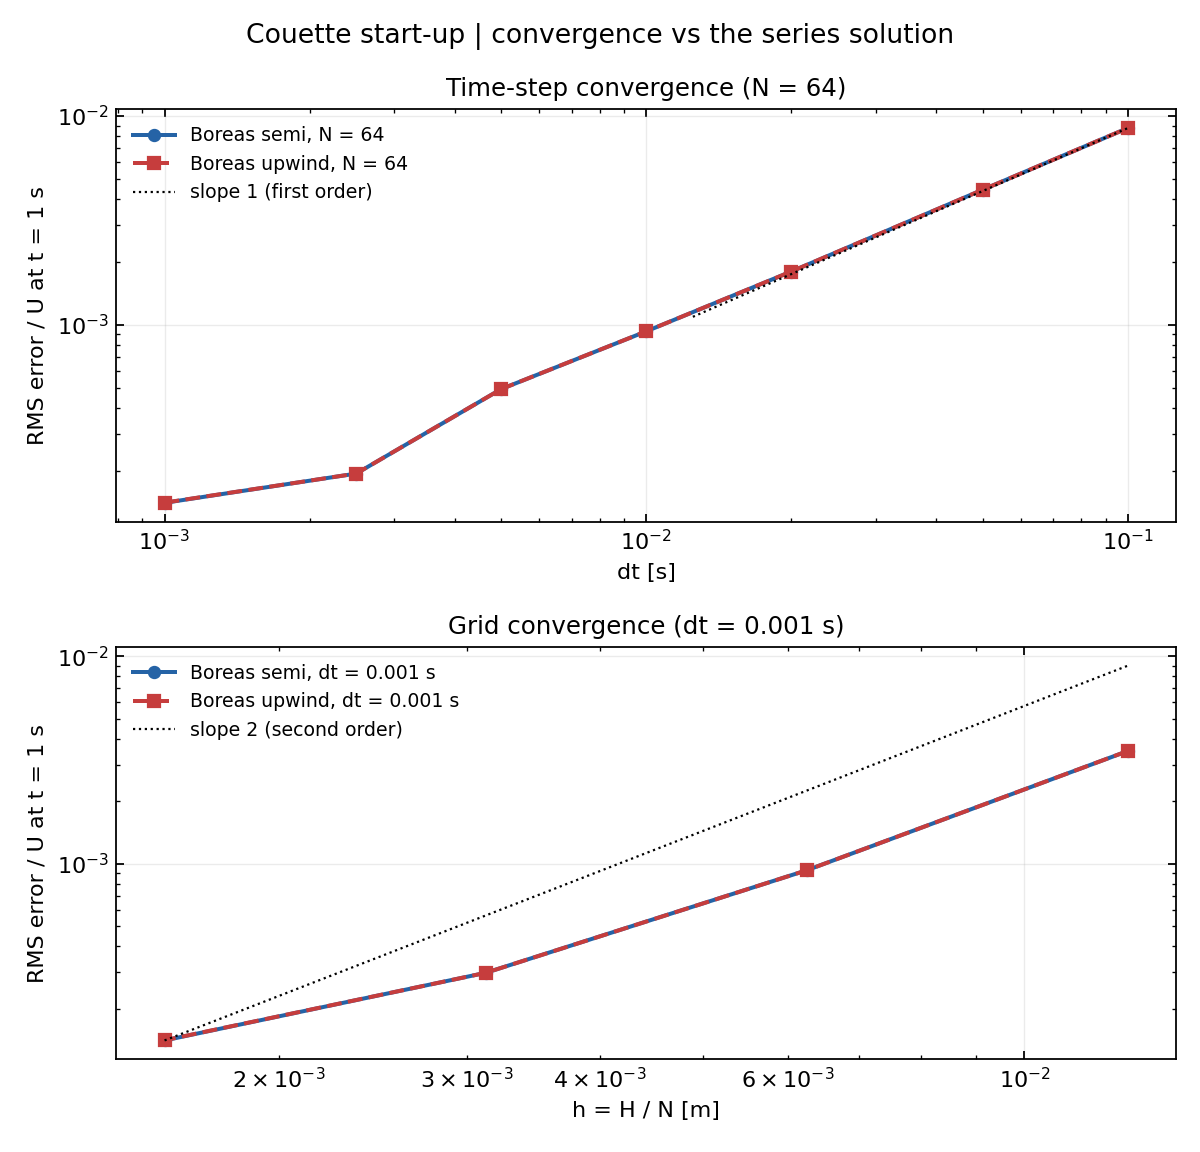
Top: reducing the time step at N = 64. Bottom: refining the mesh at dt = 0.001 s. Both show RMS error at t = 1 s; dashed guides have first- and second-order slopes.
| dt [s] at N = 64 | 0.1 | 0.05 | 0.02 | 0.01 | 0.005 | 0.0025 | 0.001 |
|---|---|---|---|---|---|---|---|
| RMS error/U at t = 1 s | 8.75e-3 | 4.44e-3 | 1.80e-3 | 9.31e-4 | 4.93e-4 | 1.94e-4 | 1.41e-4 |
From dt = 0.1 to 0.005 s, error is proportional to dt, as expected for first-order implicit Euler integration. At dt ≤ 0.0025 s, the N = 64 spatial error of about 1e-4 becomes visible and flattens the curve.
| N at dt = 0.001 s | 8 | 16 | 32 | 64 |
|---|---|---|---|---|
| RMS error/U at t = 1 s | 3.50e-3 | 9.31e-4 | 2.98e-4 | 1.41e-4 |
| Error ratio from previous mesh | — | 3.76 | 3.12 | 2.11 |
The error ratio approaches four as N doubles, consistent with second-order centered diffusion. The ratio falls at N = 64 because the remaining temporal error contributes.
CPU–GPU comparison
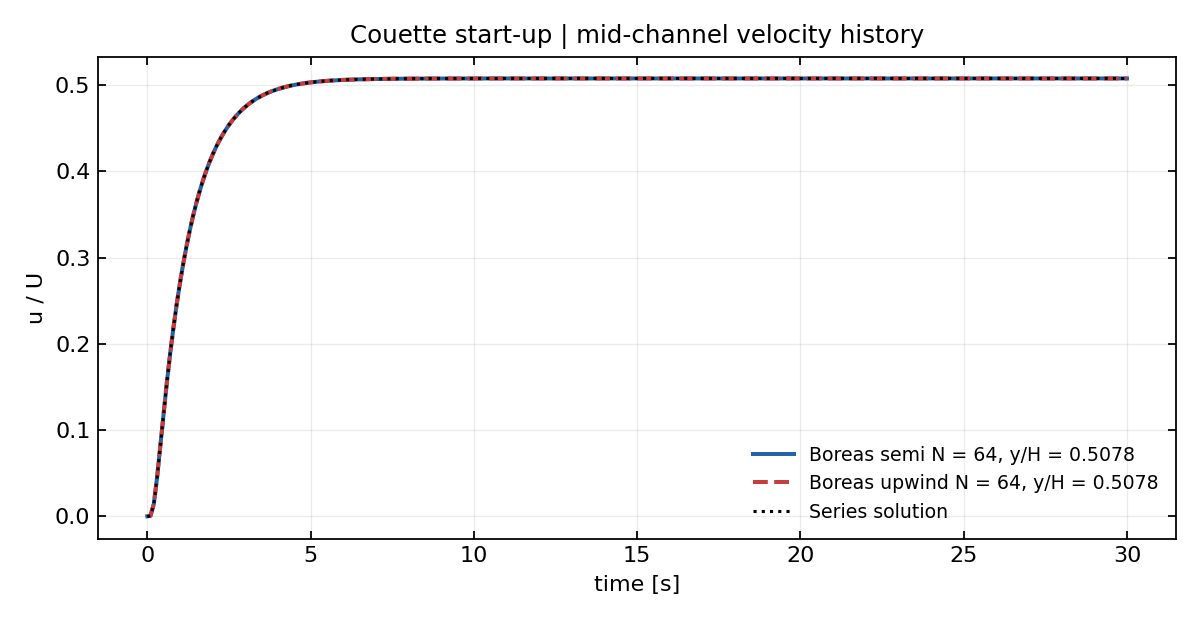
Velocity at y/H = 0.508 for N = 64 and dt = 0.001 s. Semi-Lagrangian and upwind overlap the dashed series solution.
Two decks at N = 64 and dt = 0.005 s were also run on GPU. The maximum GPU–CPU difference over all times and positions is 1.6e-4 U, below the validation error of 4.9e-4 for the same decks.
Quantitative results
| Metric | Value |
|---|---|
| RMS error/U at t = 1 s (N = 64, dt = 0.001 s) | 1.41e-4 |
| Time-step convergence order (dt = 0.1 to 0.005 s) | 1 |
| Mesh convergence order (N = 8 to 32) | Approximately 2 |
| Maximum GPU − CPU difference/U | 1.6e-4 |
At steady state (t ≈ 30 s), error is at most 2e-5 U. This floor rises slightly as dt decreases for an unknown reason, but remains one to three orders of magnitude below the errors used for the convergence assessment.