
With uniform plug flow and a distributed CO₂ source, concentration rises linearly from inlet to outlet. This analytical case directly checks Boreas's scalar transport equation, volumetric source, inlet condition, and outlet mass balance. The results shown are from Boreas v0.10.0 on CPU; identical decks were also run on GPU for comparison.
Model and boundary conditions
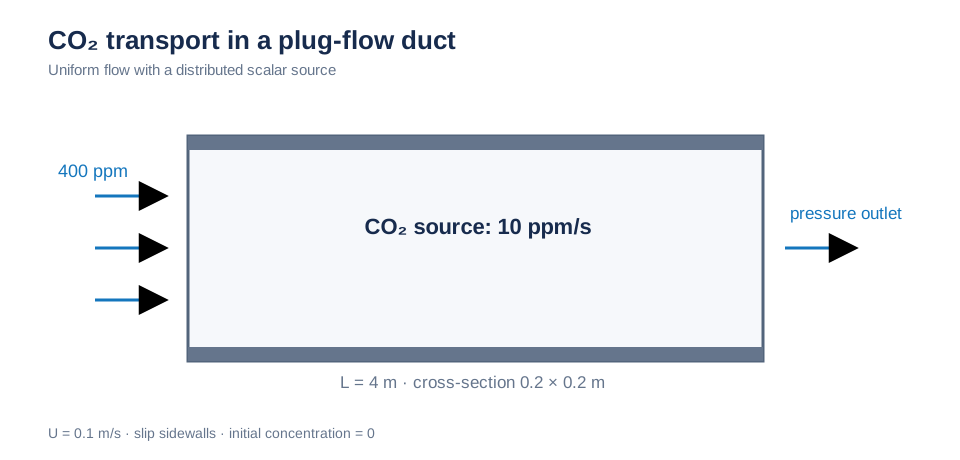
The 4 m duct has 400 ppm at the inlet and a distributed CO₂ source of 10 ppm/s. Sidewalls use slip conditions. Schematic; not to scale.
Analytical solution
For steady flow at uniform velocity U, a source S′ per unit duct length gives the axial balance below, where Q is volumetric flow rate:
Here C_in = 400 ppm and S′/Q = 100 ppm/m, so C(x) = 400 + 100x ppm. At L = 4 m, the outlet is 800 ppm and the duct-wide average is 600 ppm. Slip conditions on the four lateral walls eliminate cross-sectional variation.
Simulation setup
| Item | Boreas setting |
|---|---|
| Duct | Length 4 m, cross-section 0.2 × 0.2 m, slip conditions on all four lateral walls |
| Flow | Uniform inlet velocity U = 0.1 m/s, pressure outlet, residence time L/U = 40 s |
| CO₂ | Inlet 400 ppm; distributed source 10 ppm/s (= 100 ppm/m × U); diffusivity 1.6e-5 m²/s; initial concentration 0 |
| Mesh | Uniform h = 0.05 m (80 × 4 × 4 = 1,280 cells) |
| Time | dt = 0.25 s, 200 s total (five residence times), monitors every 5 s |
| Advection | Both semi-Lagrangian and upwind |
| Comparison | Four cell-center probes at x = 0.075, 1.075, 2.075, and 3.075 m; outlet mass average and duct volume average at steady state |
Axial concentration
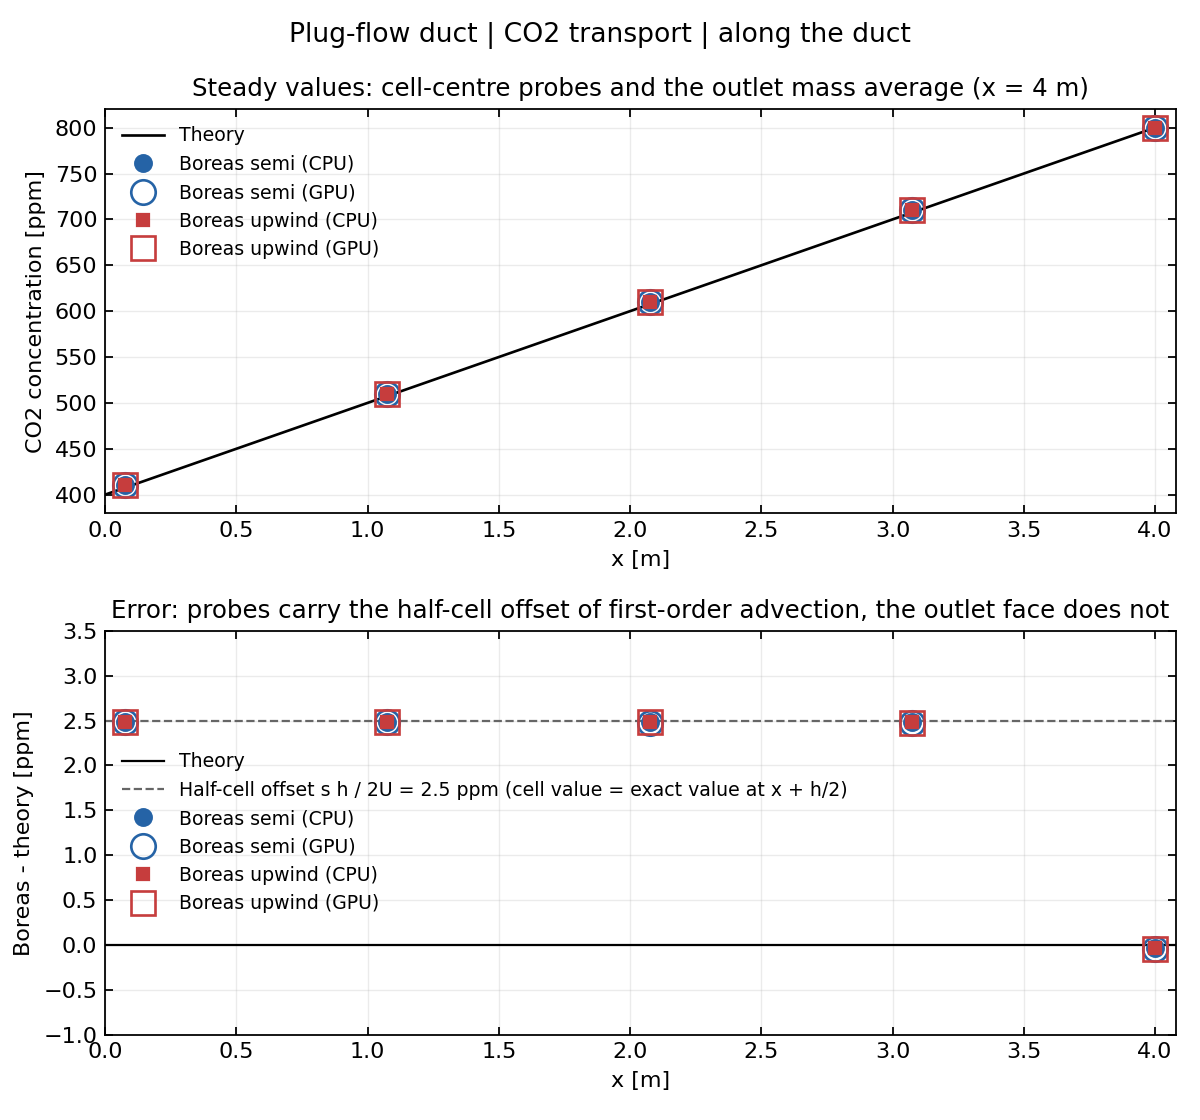
Top: four steady-state probes and the outlet mass average at x = 4 m. The solid line is the analytical solution; filled and open markers are CPU and GPU results. Bottom: Boreas minus analytical solution. Cell-center probes lie on the half-cell offset s·h/(2U) = 2.5 ppm (gray dashed line), while the face-based outlet average has zero offset.
The probes are consistently about 2.5 ppm above the analytical cell-center values. At steady state, first-order upwind and semi-Lagrangian cell values match the exact solution at the downstream face, x + h/2. Thus the offset is source rate × half-cell travel time = s·h/(2U) = 10 × 0.05/0.2 = 2.5 ppm and scales with mesh spacing. After removing it, probe errors are at most 0.02 ppm. The outlet mass average is a face value and needs no correction.
Transient history
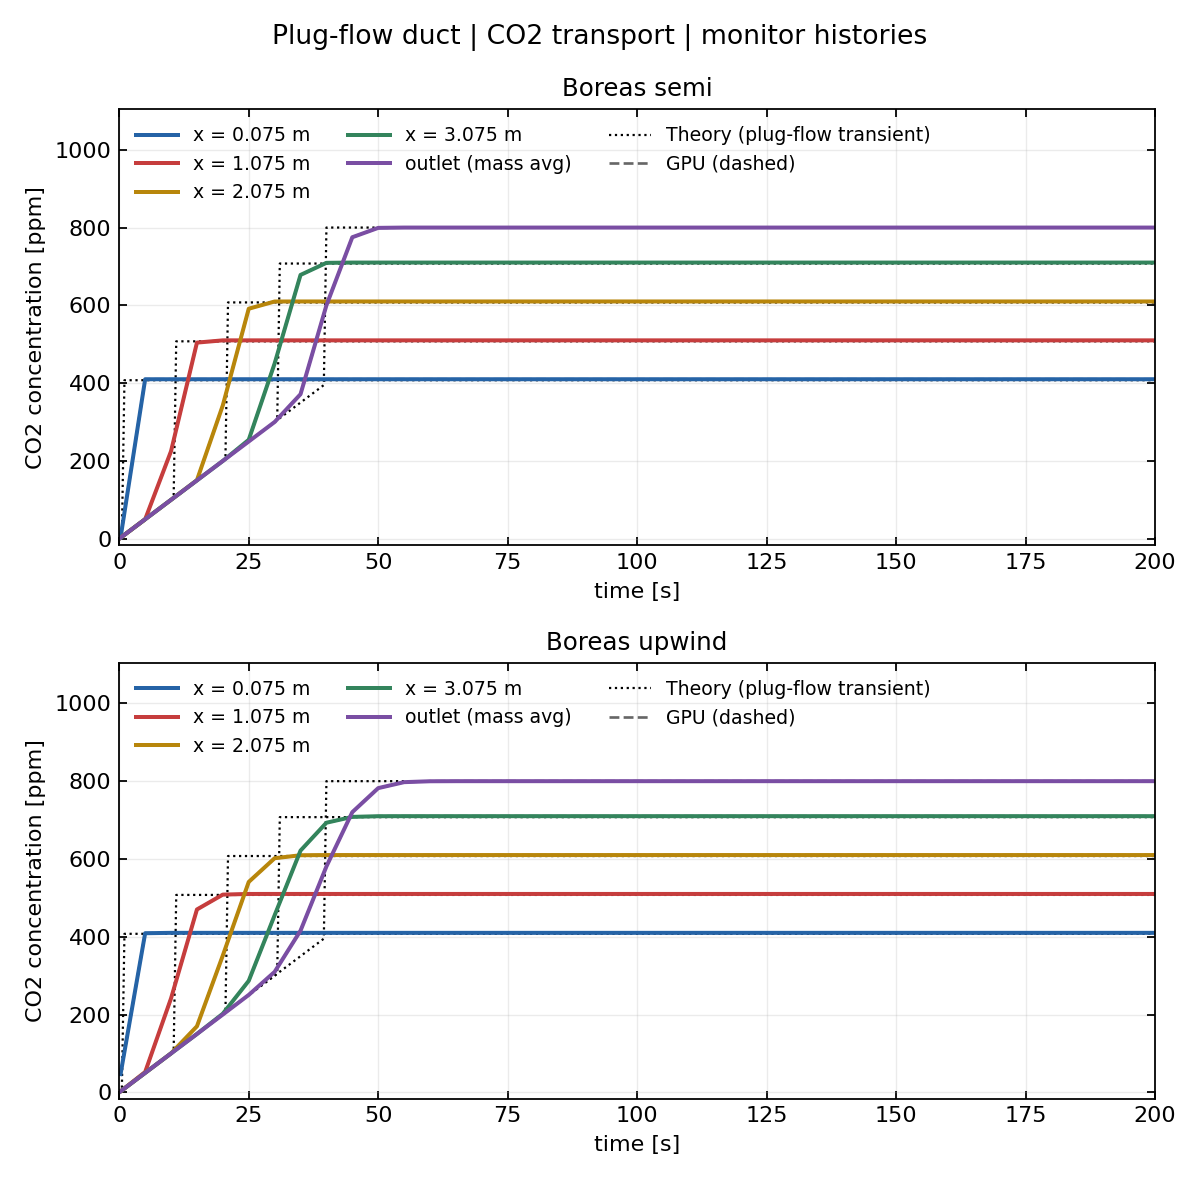
Semi-Lagrangian above, upwind below. Before inlet air arrives (t < x/U), concentration rises at the source rate; afterward it stays at the theoretical steady value. The black dashed line is the plug-flow transient solution. Dashed GPU curves overlap the CPU curves.
First-order numerical diffusion spreads the concentration front, making the approach to steady state more gradual than the theoretical front without changing the final value. The outlet reaches steady state at about 50 s; all values remain stable through 200 s.
Quantitative results
| Metric | Analytical | Boreas semi | Boreas upwind |
|---|---|---|---|
| Outlet mass average [ppm] | 800 | 799.964 | 799.965 |
| Outlet relative error | — | −0.005% | −0.004% |
| Probe offset, four points [ppm] | 2.5 (half cell, s·h/2U) | +2.481 to +2.484 | +2.482 to +2.484 |
| Duct volume average [ppm] | 600 (plus 2.5 half-cell offset) | 602.482 | 602.482 |
| Maximum GPU − CPU difference at steady monitors [ppm] | — | 0.007 | 0.006 |
Semi-Lagrangian and upwind agree within 0.002 ppm. The maximum GPU–CPU difference of 0.007 ppm is attributable to single-precision field storage. At a cell Péclet number of 312, advection dominates the specified diffusivity of 1.6e-5 m²/s, so this case does not validate the diffusion solver. The expected reduction of the half-cell offset with mesh refinement was not tested directly.