
Overview
This document is a literature-based case study. It reconstructs the geometry, airflow, and heat-load conditions of a real data center reported in the literature to present the main outputs Boreas produces at full scale; because the reference studies do not report sufficient information, this document does not include quantitative validation.
The data center considered in this case is a raised-floor facility of approximately 690 m² located in Massachusetts, USA. The reference studies report 151 racks, 12 power distribution units (PDUs), 183 perforated floor tiles with a 25% open area ratio, and 42 ceiling exhaust tiles. The total facility power is approximately 344 kW, and the total cooling airflow rate is 152,000 m³/h.
The Boreas model reconstructed the irregular floor plan reported in the reference studies within a 30.0 m × 22.2 m × 3.3 m computational domain. The model includes rack rows of varying lengths, standalone racks, PDUs, and floor supply openings with location-dependent airflow rates.
Each rack was modeled using a black-box recirculator boundary that drew air through the inlet face at the specified airflow rate, added the specified heat load, and discharged the heated air through the opposite exhaust face. A recirculator boundary was defined for each of the 151 racks, while the PDUs were modeled as adiabatic solids.
Tian, W., VanGilder, J., Condor, M., Han, X., and Zuo, W. “An Accurate Fast Fluid Dynamics Model for Data Center Applications.”
Han, X., Tian, W., VanGilder, J., Zuo, W., and Faulkner, C. “An Open Source Fast Fluid Dynamics Model for Data Center Thermal Management.”
Pardey, Z. M., VanGilder, J. W., Healey, C. M., and Plamondon, D. W. “Creating a Calibrated CFD Model of a Midsize Data Center.” InterPACK-ICNMM 2015.
Simulation Model
The floor plan reported by Han et al. includes an irregular arrangement of 42U and 45U racks, perforated floor tiles with a 25% open area ratio, and PDUs. The layout contains both long rack rows and short rack groups, and the number and locations of perforated floor tiles vary among the aisles.
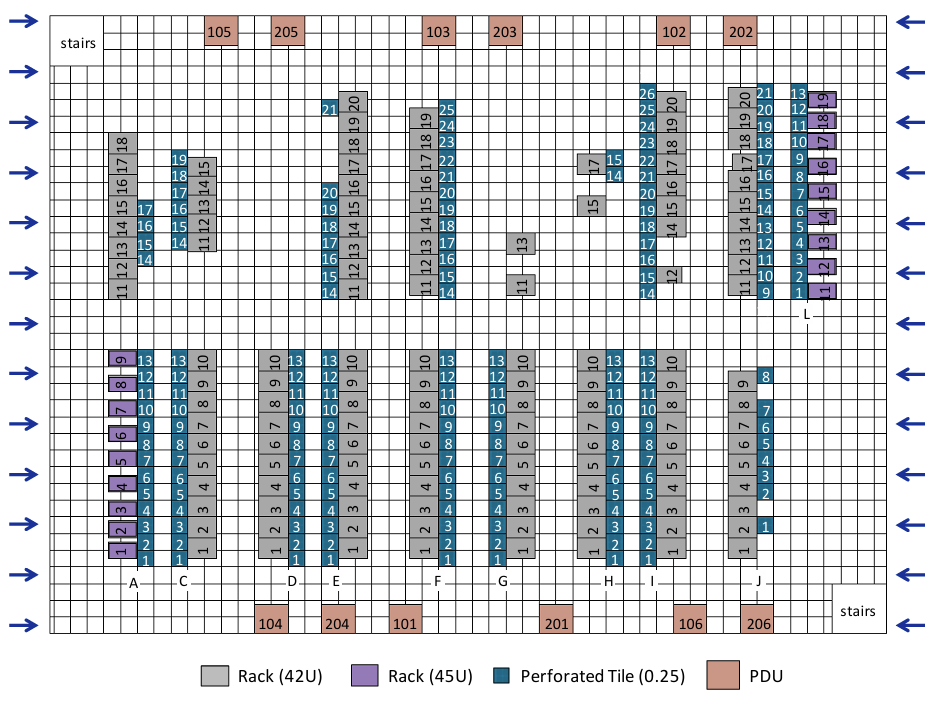
Layout of the racks, perforated floor tiles with a 25% open area ratio, and PDUs reported by Han et al. Gray indicates the 42U racks, purple the 45U racks, cyan the perforated floor tiles, and brown the PDUs.
The rack inlet and exhaust orientations were specified individually in the Boreas model. The perforated floor tiles were modeled as floor supply boundaries, and 42 ceiling exhaust boundaries were placed in the ceiling.
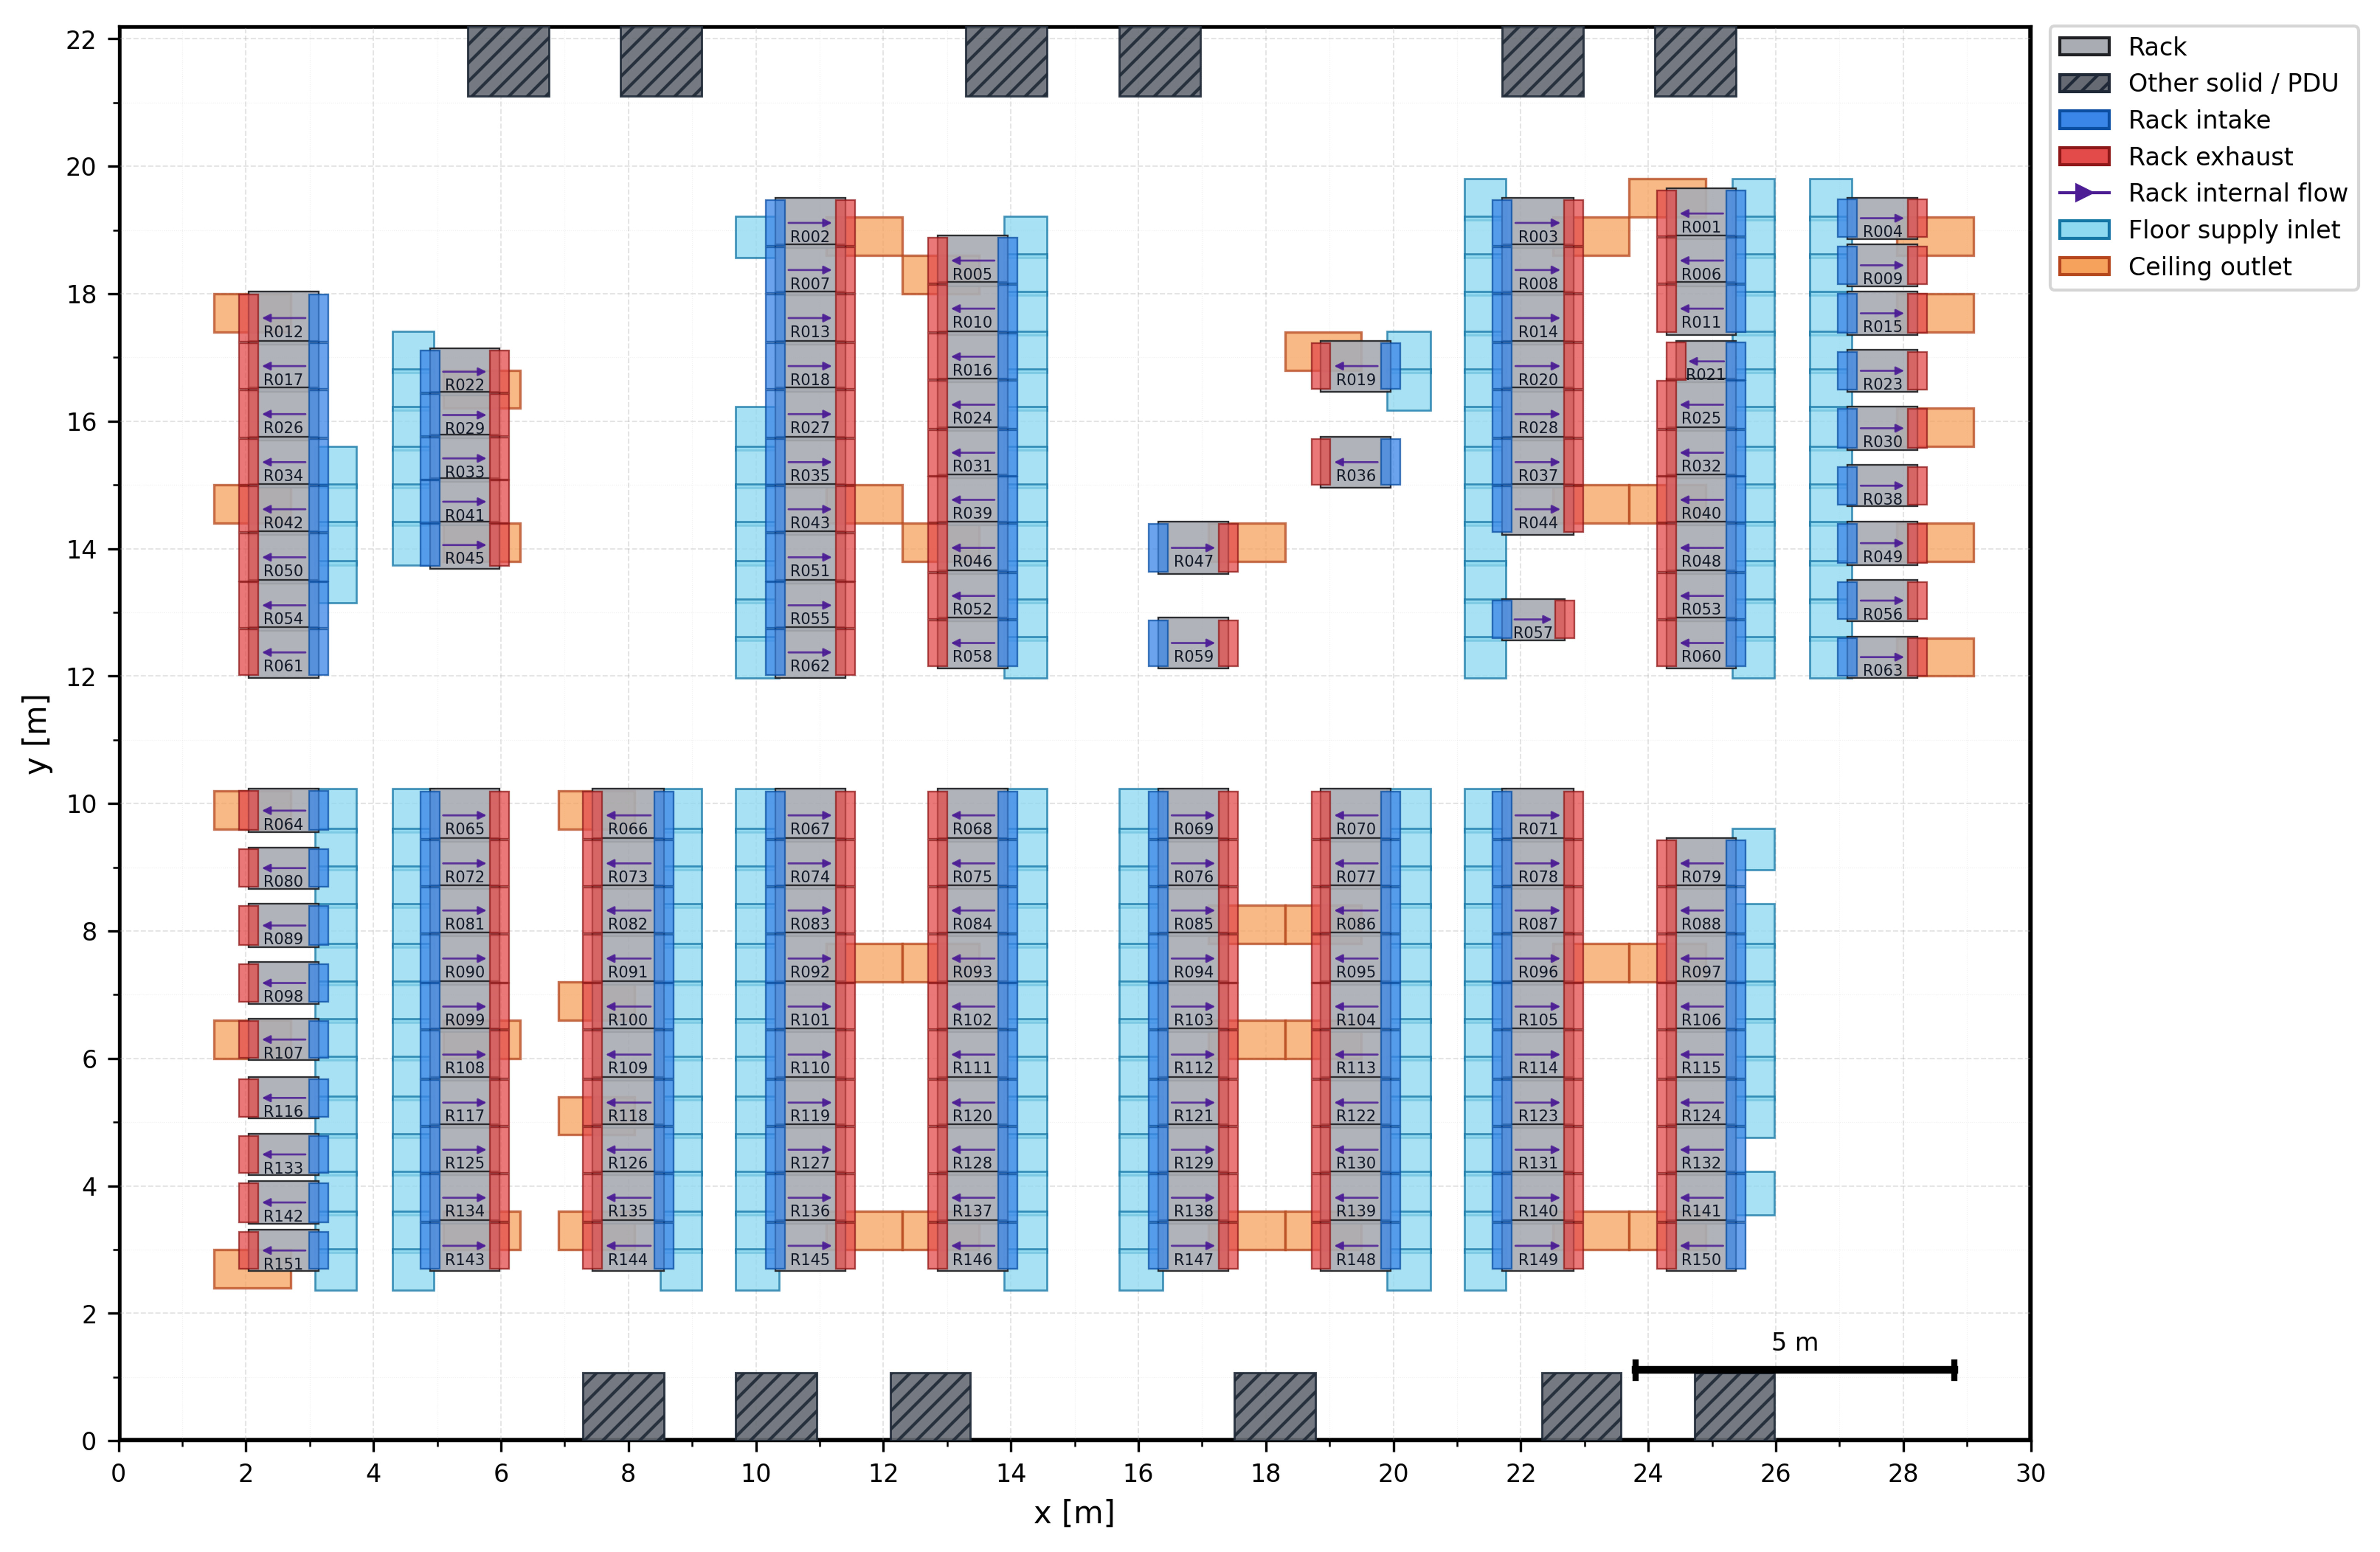
Gray indicates the racks, blue the rack inlet faces, red the rack exhaust faces, purple arrows the airflow direction through the racks, light blue the floor supply boundaries, and light brown the ceiling exhaust boundaries.
The figure above is a plan view of the simulation model. It shows the rack inlet and exhaust orientations, floor supply boundary locations, ceiling exhaust boundary locations, and the arrangement of solid equipment. The main simulation conditions are listed below.
| Parameter | Value |
|---|---|
| Computational domain | 30.0 m × 22.2 m × 3.3 m |
| Rack recirculator boundaries | 151 |
| PDUs | 12 |
| Floor supply boundaries | 183 |
| Ceiling exhaust boundaries | 42 |
| Total rack heat load | 344 kW |
| Total rack airflow rate | 72,928 m³/h |
| Total floor supply airflow rate | 152,000 m³/h |
| Supply and initial air temperatures | 20 °C |
The rack airflow rate was specified as 212 m³/h per 1 kW of IT heat load, consistent with Han et al. For the total rack heat load of 344 kW, the total airflow rate through the racks was 72,928 m³/h.
Location-specific supply velocities were specified for the 183 perforated floor tiles. The sum of the airflow rates through all tiles was 152,000 m³/h, matching the total cooling airflow rate reported in the reference study.
Steady-State Temperature Distribution
The figure below shows the temperature distribution on a horizontal plane. The rack arrangement and the locations of the elevated-temperature regions can be identified.
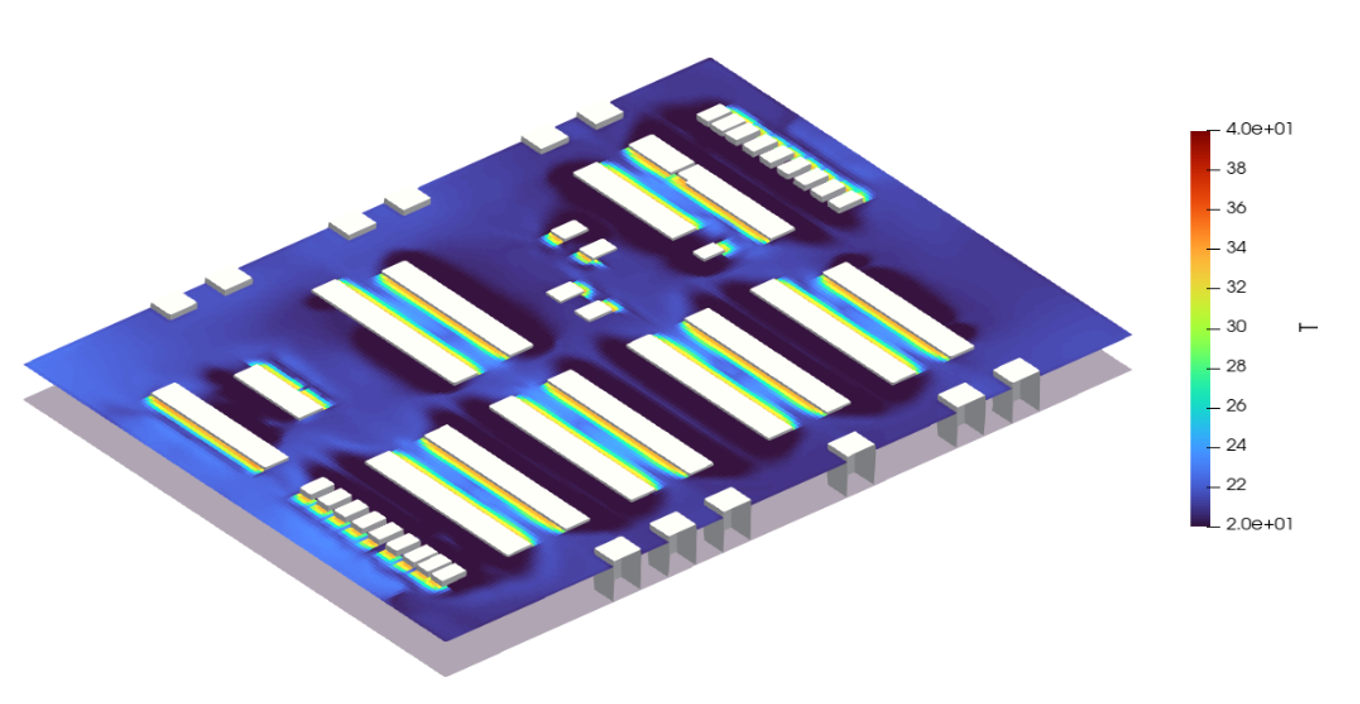
Rack geometry and temperature distribution on a horizontal plane. High-temperature regions formed along the rack exhaust faces, while lower-temperature air was distributed near the rack inlet faces and in the main aisles.
High-temperature regions were concentrated mainly along the rack exhaust faces. Lower temperatures occurred near the rack inlet faces and in the perimeter aisles. The shape of each high-temperature region varied with the length and orientation of the corresponding rack row.
The horizontal plane at z = 1.67 m showed distinct low-temperature regions in the cold aisles and high-temperature regions in the hot aisles. The temperature color scale was set to 20–40 °C.
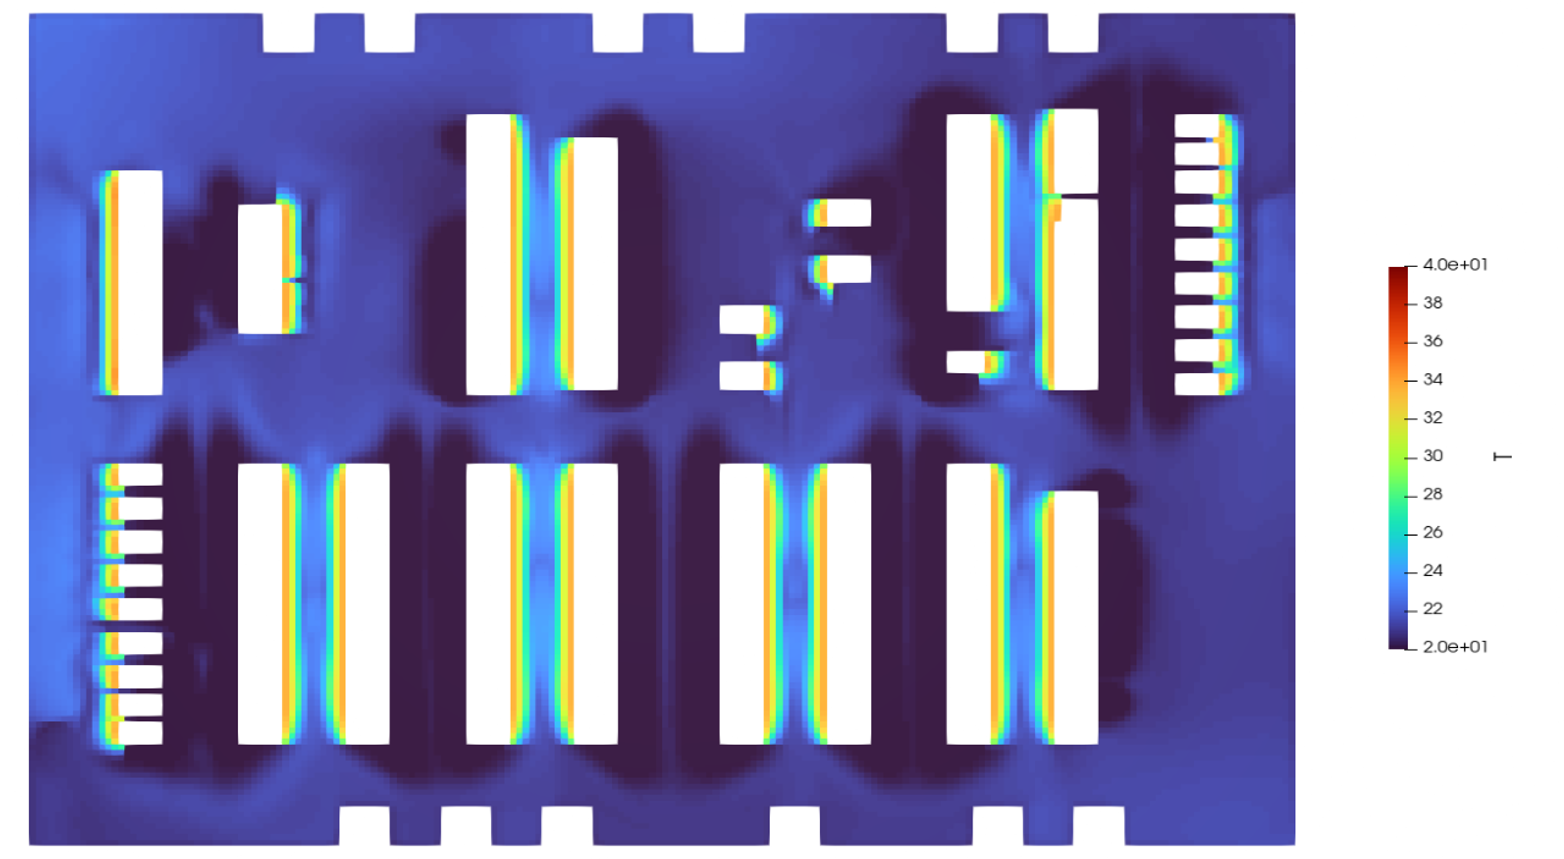
Temperature distribution on a horizontal plane at z = 1.67 m. High-temperature bands formed along the rack exhaust faces, while lower temperatures were maintained near the rack inlet faces and in the main aisles.
Continuous high-temperature regions formed along the exhaust faces of the long rack rows. Localized regions of elevated temperature appeared near the individual exhaust faces of standalone racks and short rack groups. Temperatures near the rack inlet faces and across large portions of the room were mainly within approximately 20–24 °C.
The vertical-plane results showed low-temperature air near the floor and the lower portions of the racks, together with heated air rising from the rack exhaust faces.
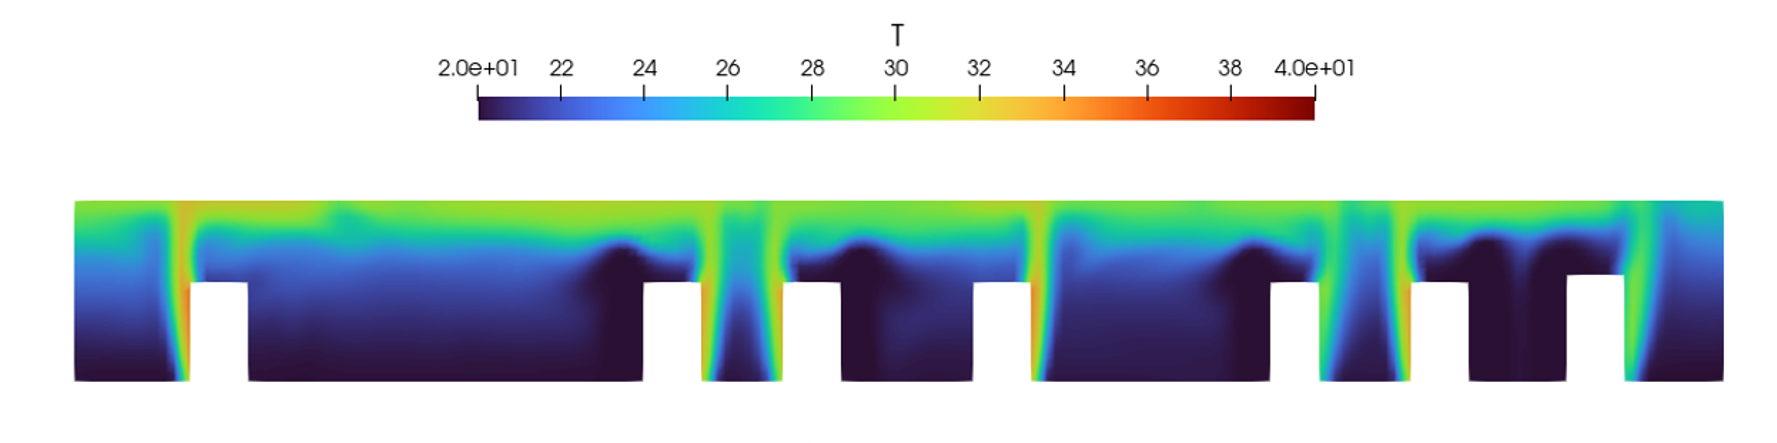
Temperature distribution on a vertical plane, showing heated air rising from the rack exhaust faces and spreading toward the ceiling.
The heated air discharged from the rack exhaust faces rose toward the upper part of the room. The location and extent of the rising hot airflow varied among the rack rows, and broad high-temperature regions formed near the ceiling as the rack exhaust air spread.
The combined horizontal and vertical planes allowed the plan-view locations and vertical extent of the high-temperature regions to be compared simultaneously.
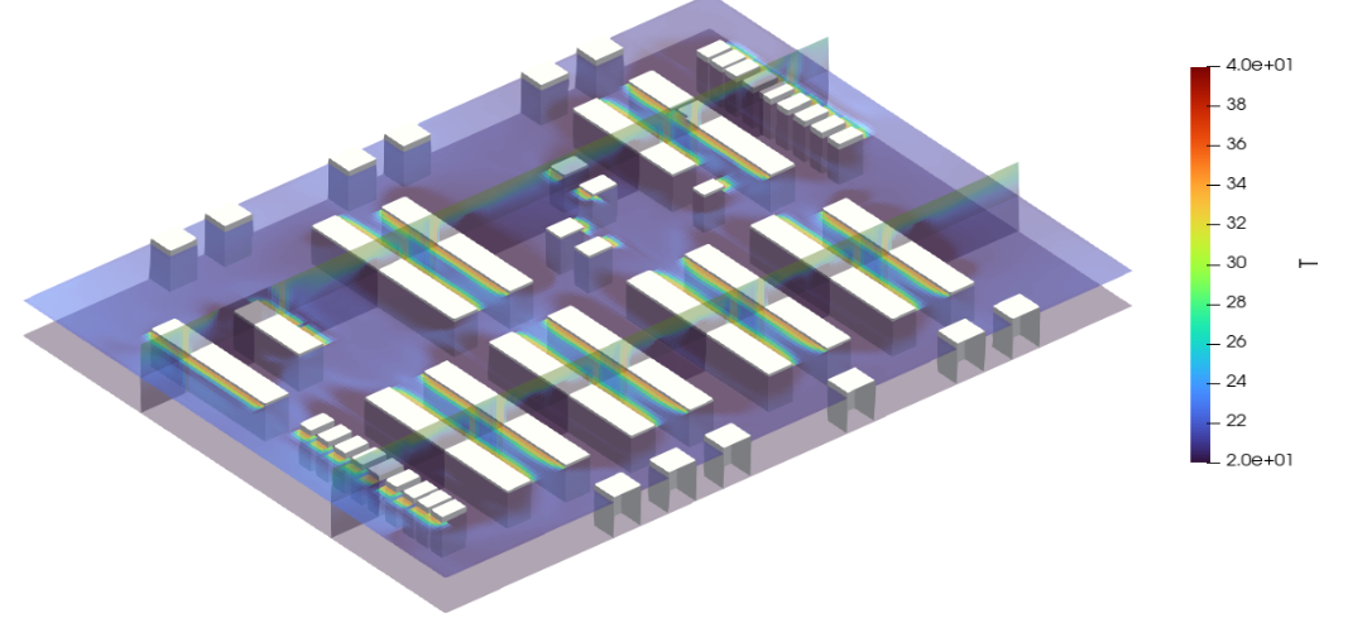
Temperature distribution shown on a horizontal plane and multiple vertical planes. Regions of elevated temperature originating at the rack exhaust faces extended above the racks and toward the ceiling.
Quantitative Results — Rack Inlet and Exhaust Temperatures
For all 151 racks, the flow-weighted average inlet temperatures ranged from 20.00 to 20.64 °C, and the flow-weighted average exhaust temperatures ranged from 30.46 to 33.95 °C. The figure below presents the results for R001–R010.
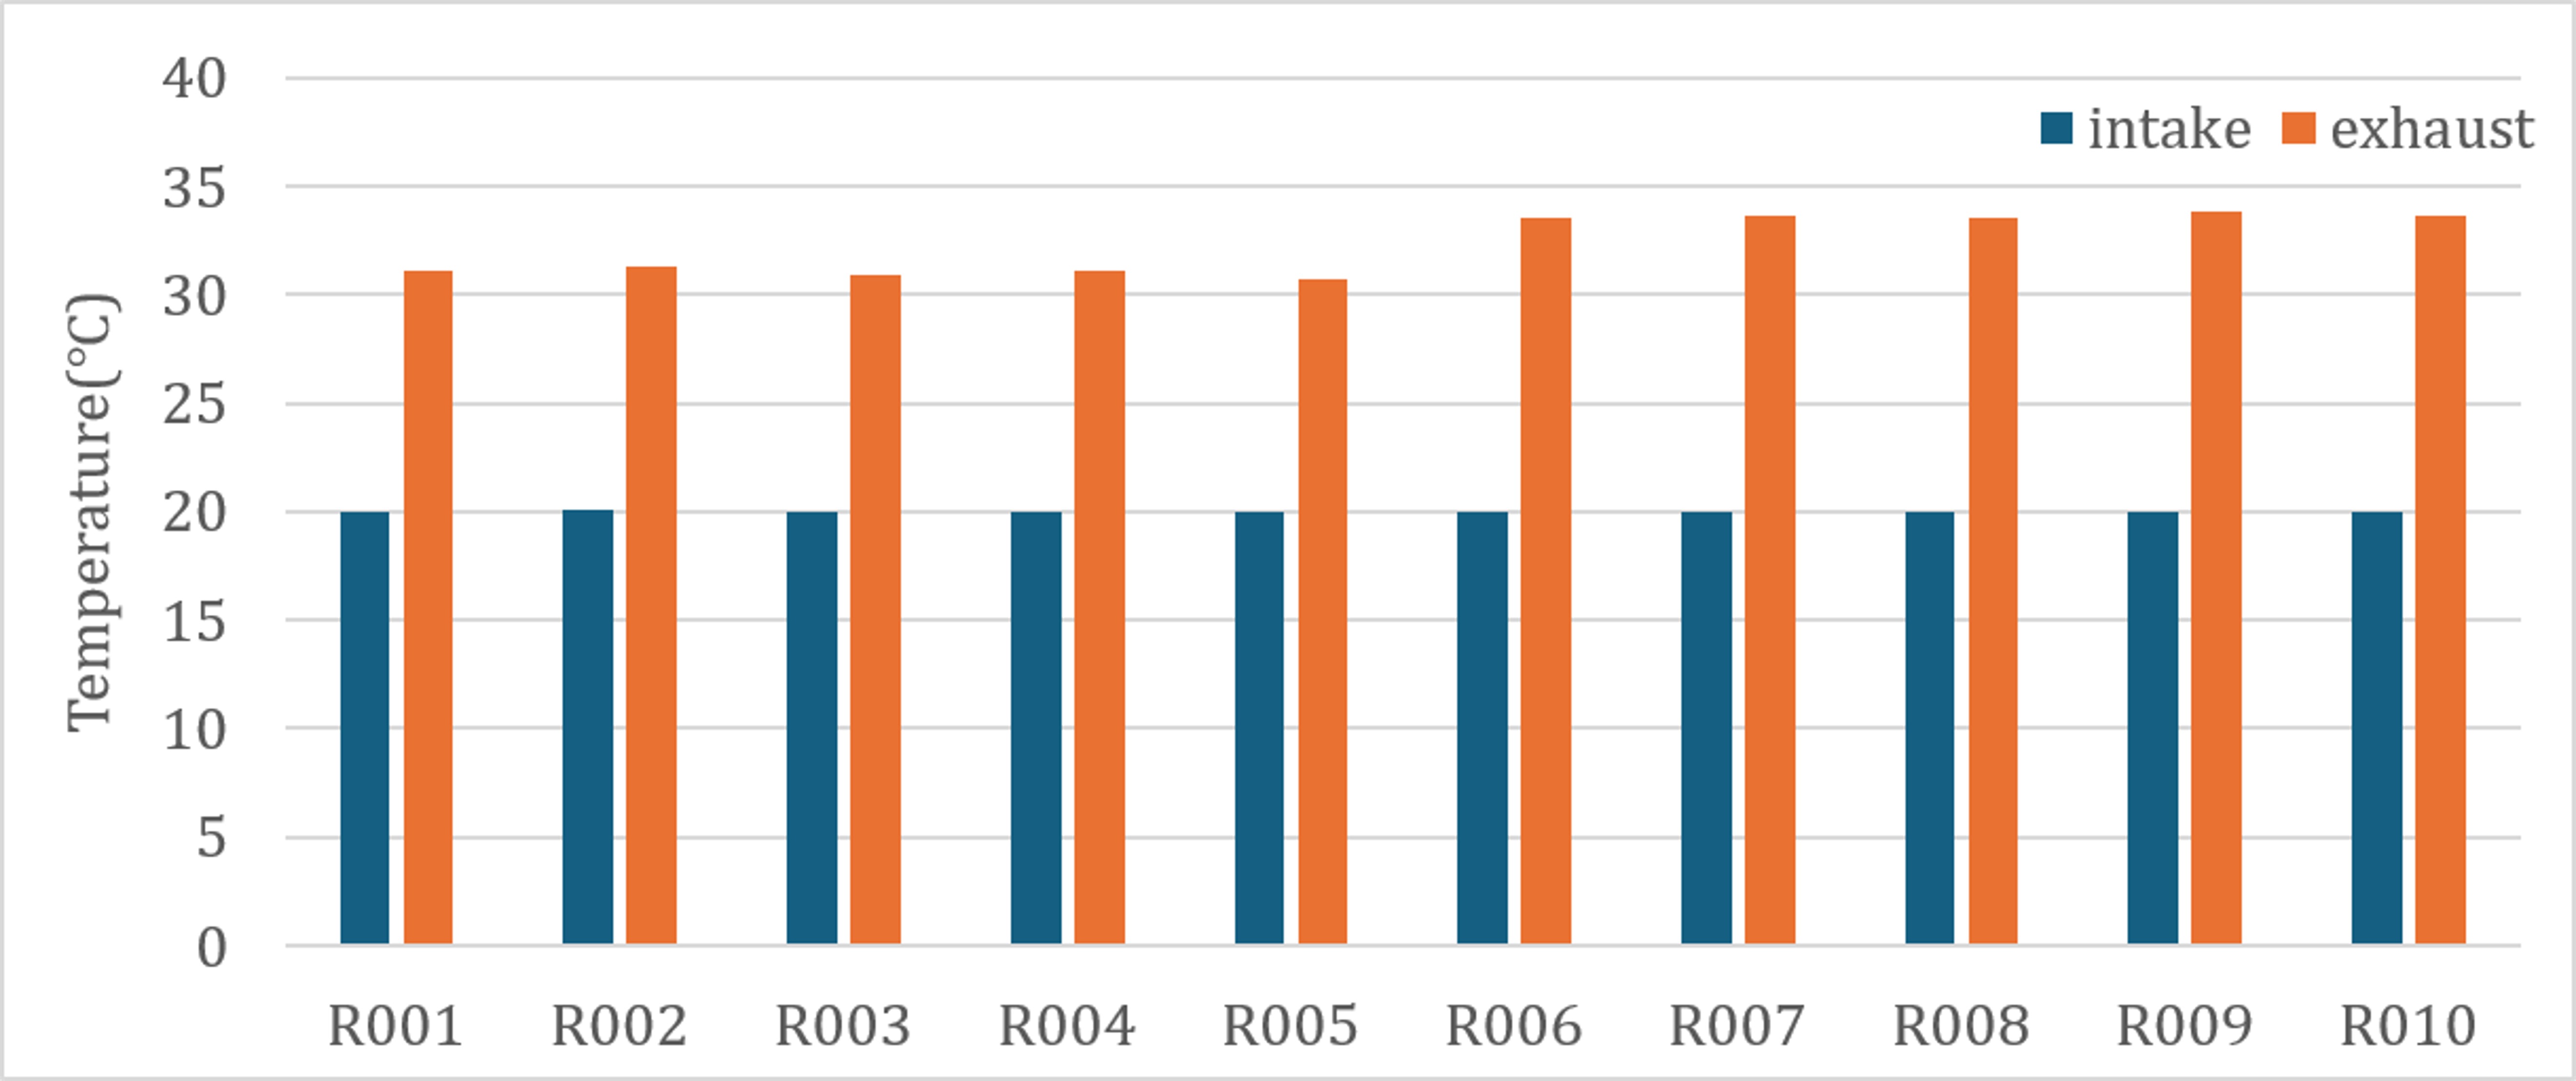
Flow-weighted rack inlet and exhaust temperatures for R001–R010. The inlet temperatures remained near 20 °C, while the exhaust temperatures ranged from approximately 31 to 34 °C.
The rack inlet temperatures for R001–R010 remained nearly constant at approximately 20 °C. The rack exhaust temperatures were approximately 31 °C for R001–R005 and approximately 34 °C for R006–R010, resulting in a difference of approximately 3 °C between the two groups.
R006 had the lowest rack inlet temperature, 20.00 °C, whereas R012 had the highest, 20.64 °C. R146 had the lowest rack exhaust temperature, 30.46 °C, and R041 had the highest, 33.95 °C. The inlet temperatures spanned 0.64 °C across all racks, and the exhaust temperatures spanned 3.49 °C.
Flow Field — Cold-Aisle Supply Airflow
The three-dimensional streamlines illustrate the flow paths of low-temperature air around the racks and heated air discharged from the rack exhaust faces.
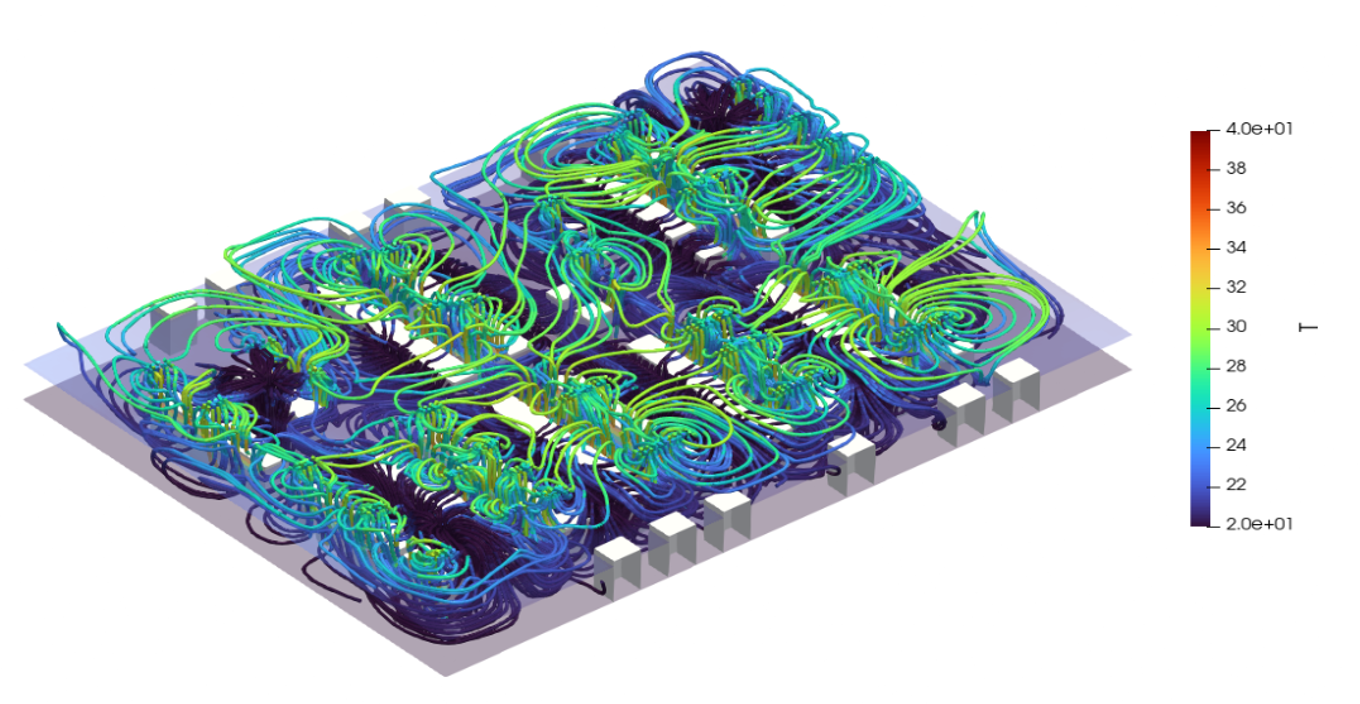
Three-dimensional streamlines colored by air temperature. Streamlines representing low-temperature air were distributed near the rack inlet faces, while those representing heated air extended from the rack exhaust faces into the upper part of the room.
The heated air from the rack exhaust faces rose toward the upper part of the room and then spread near the ceiling and into the perimeter spaces. Near the ends of the rack rows, exhaust air flowed around the row ends and recirculated toward the rack inlet faces.
Summary
This case study shows the main results obtained by applying Boreas to evaluate cooling airflow in a full-scale data center.
- Analysis of the overall temperature distribution using horizontal, vertical, and combined multi-plane views
- Comparison of the temperature distributions at the rack inlet and exhaust faces
- Calculation of the inlet and exhaust temperatures for individual racks
- Identification of high-temperature regions near the rack exhaust faces and in the upper part of the room
- Analysis of upward airflow above the racks, bypass airflow around the ends of the rack rows, and circulation paths in the perimeter spaces
- Use in comparing cooling performance under different rack arrangements and supply conditions
Boreas simulations can be used prior to detailed CFD analysis to identify zones with potential cooling deficiencies and operating conditions requiring further evaluation.