
Version: v0.4.3
1. Introduction
CFD Convergence Watch is a tool for visualizing and analyzing convergence history of monitor points from CFD (Computational Fluid Dynamics) simulations.
Load output files from various CFD solvers, view convergence trends on interactive charts, and evaluate convergence using Simple Moving Average (SMA) comparisons.
Supported Solvers
| Solver | Type | File Format |
|---|---|---|
| Generic CSV | - | .csv |
| Ansys CFX | Steady | .csv |
| FlexCompute Flow360 | Steady / Transient | .csv |
| Ansys Fluent | Steady / Transient | .out |
| SU2 | Steady | .csv |
File Format Summary
Generic CSV — Comma-delimited. First column is X-axis.
timestep, var1, var2
1, 0.001, 0.002
2, 0.001, 0.002
Ansys CFX — Comma-delimited. Quoted headers (may contain internal commas). Exported via cfx5mondata.
"ACCUMULATED TIMESTEP","USER POINT,Mass Flow Monitor","USER POINT,Pressure Ratio"
1,-4.53497200e+01,2.13941860e+00
Flow360 Steady — Comma-delimited. physical_step (first column) is ignored, pseudo_step (second column) is X-axis.
physical_step, pseudo_step, CL, CD, ...
0, 0, -1.480, 12.750, ...
0, 10, -4.620, 42.375, ...
Flow360 Transient — Comma-delimited. physical_step (first column) is X-axis. Only the last row per step is used.
physical_step, pseudo_step, CL, CD, ...
0, 0, -2.418, 2.240, ...
0, 24, -2.418, 2.240, ...
1, 0, -2.418, 2.240, ...
Ansys Fluent — Space-delimited .out file. The line starting with ( is the header (everything above is comments).
"force-and-mom-file-0"
"Iteration" "fx-1-stabaxis etc.."
("Iteration" "fx-1-stabaxis" "fz-1-stabaxis" "my-1")
1 175342.7 220725.8 18475.2
SU2 — Comma-delimited. Time_Iter, Outer_Iter (first two columns) are ignored, Inner_Iter (third column) is X-axis.
"Time_Iter","Outer_Iter","Inner_Iter","rms[P]","rms[U]"
0,0,0,-4.953,-16.084
0,0,1,-5.073,-4.883
2. Layout
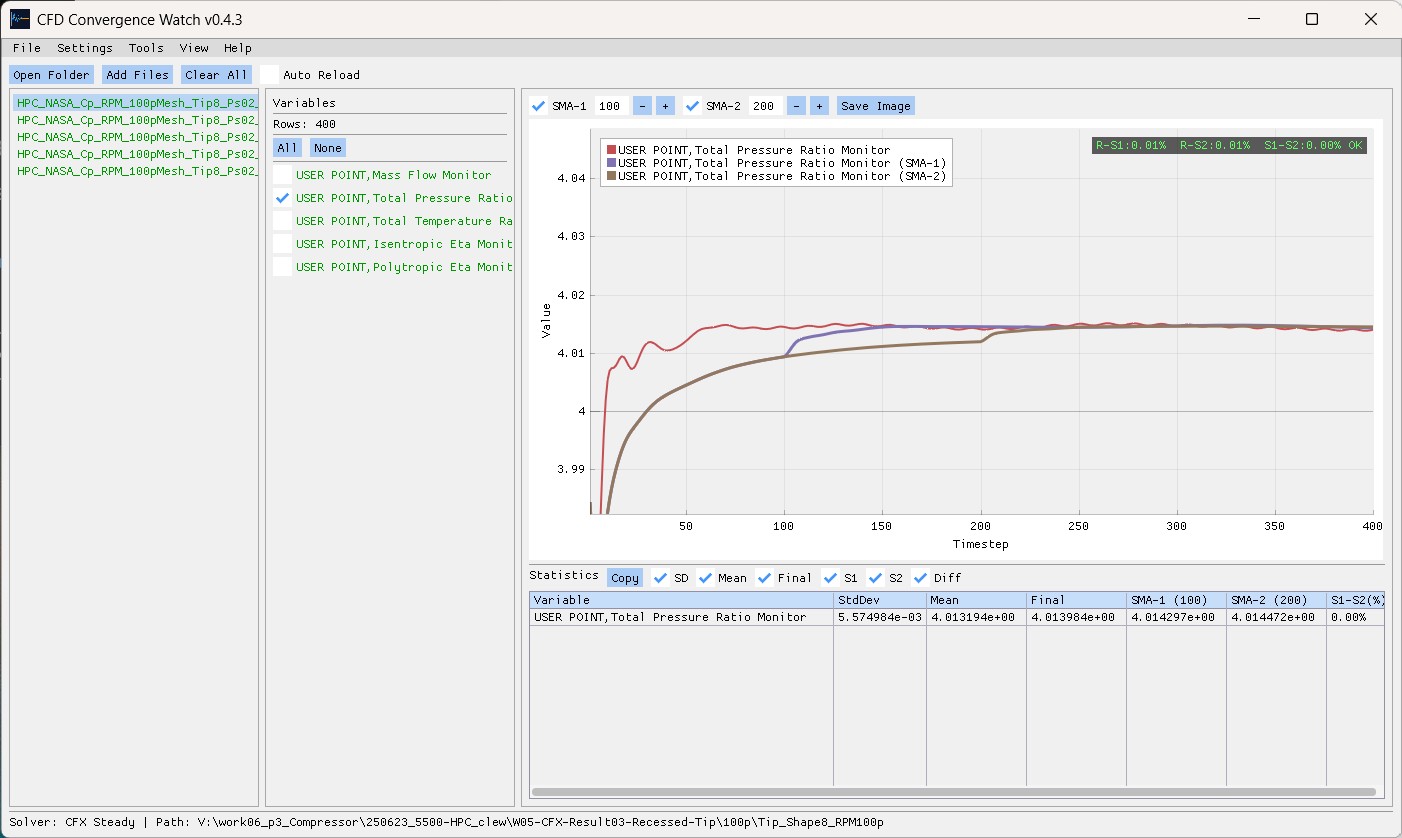
The application consists of three panels and a status bar.
+----------+----------+-------------------------------+
| File     | Variable | Chart                         |
| Panel    | Panel    |                               |
|          |          |  SMA Controls                 |
| File     | Variable |  ImPlot Chart                 |
| List     | Checks   |  (with convergence overlay)   |
|          |          +-------------------------------+
|          |          | Statistics Table              |
|          |          | (stats + clipboard copy)      |
+----------+----------+-------------------------------+
| Status Bar: Solver: Flow360 Steady | Path: ...      |
+-----------------------------------------------------+- File Panel (left): List of loaded files. Click to select.
- Variable Panel (center): Variable checkboxes. All/None buttons for bulk selection.
- Chart Panel (right): Chart, convergence overlay, SMA controls, and statistics table.
- Status Bar (bottom): Displays the current solver and folder path.
Drag the dividers between panels to resize panel widths.
3. Loading Files
Open Folder
Select File > Open Folder to open a folder selection dialog. All supported files (.csv, .out) in the selected folder are loaded automatically.
Errors may occur if files with different solver formats share the same extension in the same folder.
Open Files
Select File > Open Files or click the Add Files button in the File Panel to open a file selection dialog. Multiple files can be selected at once.
- Supported filters: All Supported (
.csv,.out), CSV Files (.csv), Fluent Output (.out) - Duplicate files are not loaded.
- Files are automatically sorted by name.
Clear All
Select File > Clear All to remove all loaded files.
Auto Reload
Enable the Auto Reload checkbox at the top of the File Panel to poll loaded files every 2 seconds and reload any that have been modified.
- Useful for monitoring convergence in real time while the solver is still running.
- While Auto Reload is enabled, the chart's X-axis automatically follows the data to the latest point.
4. CFD Solver Selection
Select the appropriate solver from Settings > CFD Solver.
| Solver | Description |
|---|---|
| Generic CSV | General-purpose CSV. First column is X-axis |
| CFX Steady | Ansys CFX convergence history. Quoted headers supported |
| Flow360 Steady | Drops physical_step, pseudo_step becomes X-axis |
| Flow360 Transient | Keeps only the last row per physical_step group |
| Fluent Steady | .out file, Iteration is X-axis |
| Fluent Transient | .out file, Time Step is X-axis |
| SU2 Steady | Drops Time_Iter and Outer_Iter, Inner_Iter becomes X-axis |
Changing the solver automatically reloads all loaded files with the new solver settings.
Legend Position
Change the chart legend position from Settings > Legend Position.
| Option | Description |
|---|---|
| Inside (Top-Left) | Inside the chart, top-left corner (default) |
| Outside (Right) | Outside the chart, right side |
| Outside (Top) | Outside the chart, top |
| Outside (Bottom) | Outside the chart, bottom |
CFX Install Path
Select Settings > CFX Install Path to open a modal for configuring the CFX bin folder path.
- The current path is shown in an editable text field. You can type directly or use the Browse button to select a folder.
- The path should point to the folder containing
cfx5mondata.exe(e.g.,C:\Program Files\ANSYS Inc\v242\CFX\bin). - Required for the Tools > Extract from CFX feature.
X-Axis Warning
If the X-axis values are not sequential (non-uniform step size) when data is loaded, a warning modal is displayed. This may indicate an incorrect solver selection for the data. Please verify the solver in Settings > CFD Solver.
5. Chart
Variable Selection
Check the variables to display in the Variable Panel.
- All: Select all variables
- None: Deselect all variables
Only checked variables are shown in the chart and statistics table.
SMA (Simple Moving Average)
Use the SMA controls at the top of the chart to configure moving averages.
- SMA-1 / SMA-2: Enable/disable each with checkboxes
- Set window size via the number input (min 2, max = number of data rows)
- SMA lines are drawn as thick lines over the raw data
Convergence Overlay
Convergence indicators for each variable are displayed in the top-right corner of the chart.
R-S1:0.05% R-S2:0.10% S1-S2:0.03% OK| Indicator | Meaning |
|---|---|
| R-S1 | Relative difference between raw final value and SMA-1 final value (%) |
| R-S2 | Relative difference between raw final value and SMA-2 final value (%) |
| S1-S2 | Relative difference between SMA-1 and SMA-2 final values (%) |
Convergence symbols:
| Symbol | Condition | Color |
|---|---|---|
| OK | S1-S2 < 0.1% | Green |
| ~ | S1-S2 < 1.0% | Yellow |
| X | S1-S2 >= 1.0% | Red |
The same color thresholds are applied to variable names in the Variable Panel and file names in the File Panel. A file's name color reflects the worst convergence state among its variables (dark/light tones are chosen automatically based on the active theme).
Save Chart Image
Click the Save Image button next to the SMA controls to open a save dialog and write the chart area to a PNG file. The chart panel is captured at its current pixel size.
Chart Controls
The ImPlot chart supports mouse interaction:
- Drag: Pan the chart area
- Scroll: Zoom in/out
- Double-click: Reset chart range (fit)
- Right-click: Chart options menu
6. Statistics Table
Below the chart, statistics for selected variables are displayed in a table.
| Column | Description |
|---|---|
| Variable | Variable name |
| StdDev | Standard deviation |
| Mean | Mean value |
| Final | Last value |
| SMA-1 (N) | SMA-1 final value (window size N) |
| SMA-2 (N) | SMA-2 final value (window size N) |
| S1-S2(%) | Relative difference between SMA-1 and SMA-2 (%) |
Clipboard Copy
Click the Copy button to copy statistics data in tab-separated format to the clipboard. This can be pasted directly into spreadsheets such as Excel.
Use the checkboxes next to the Copy button to select which columns to copy:
- SD / Mean / Final / S1 / S2 / Diff
7. Tools
Extract from CFX
Select Tools > Extract from CFX to extract USER POINT monitor data from a CFX result file (.res) to CSV.
- CFX Install Path must be configured in Settings first.
- Select a
.resfile. - Extraction runs in the background with a spinner indicator.
- A result popup is shown on completion:
- Success:
{filename}_userpoints.csvis created in the same folder as the.resfile and automatically loaded into the app. - Failure: An error message is displayed.
- Success:
Internally, this calls ANSYS cfx5mondata.exe to perform the extraction.
8. Theme
Change the UI theme from the View menu.
- Dark (default)
- Light
- Classic
9. Settings Persistence
The following settings are automatically saved on exit and restored on next launch:
- CFD Solver selection
- Theme
- Last opened folder path
- SMA window sizes and enabled states
- Legend position
- CFX Install Path
Settings file location:
- Windows:
%APPDATA%\CfdConvWatch\cfdconvwatch.ini - Linux:
$XDG_CONFIG_HOME/CfdConvWatch/cfdconvwatch.ini(falls back to~/.config/CfdConvWatch/cfdconvwatch.ini)
The OS-standard per-user config location is used, so writes don't require elevated privileges and settings remain isolated per user account.
Trademarks
ANSYS, CFX, and Fluent are registered trademarks of ANSYS, Inc. Flow360 is a trademark of FlexCompute, Inc. SU2 was developed at Stanford University. This software is not affiliated with, endorsed by, or sponsored by any of these organizations.
License
Freeware - free for personal and commercial use. No warranty.
Copyright 2025 CLEW, Inc. https://www.clew.tech