
We compare Boreas predictions with the temperature profiles measured at the front and back of the racks in the open-aisle data center studied by Abdelmaksoud et al. (2013). Published OpenFOAM results for the same experiment from Dogan et al. (2022) are shown as reference curves.
Experiment and simulation setup
The facility contains three racks with four chassis per rack. Total rack heat output is approximately 45 kW. Cooling air at 14 °C enters through the floor supply region at approximately 3.04 m³/s. We compare temperature rise above the supply temperature along six vertical measurement lines at the rack fronts and backs.
| Item | Boreas setup |
|---|---|
| Computational domain | 7.89 × 5.64 × 3.66 m, excluding the floor plenum |
| Rack model | Three racks × four chassis; specified airflow and heat output for each chassis, with front intake and rear exhaust |
| Mesh | Base cell size 0.08 m, 0.04 m surface refinement band, approximately 467,000 cells |
| Transient simulation | 0.05 s time step, 300 s total, averaged over 150–300 s |
| Models compared | Upwind advection with either the LVEL or chen turbulence model |
Boreas represents the ten perforated floor tiles as one floor supply region and each chassis as a recirculating device with specified airflow and heat output. The detailed momentum of individual tile jets and rack openings is therefore not resolved directly.
Comparison with measured temperature profiles
Circles show experimental measurements. Blue and red solid lines show Boreas results with LVEL and chen, respectively. Gray dashed lines show the published OpenFOAM results from Dogan et al. (2022). Lines connect predictions interpolated to the same measurement heights; they are not continuous profiles of every cell in the computational grid.
Rack 1
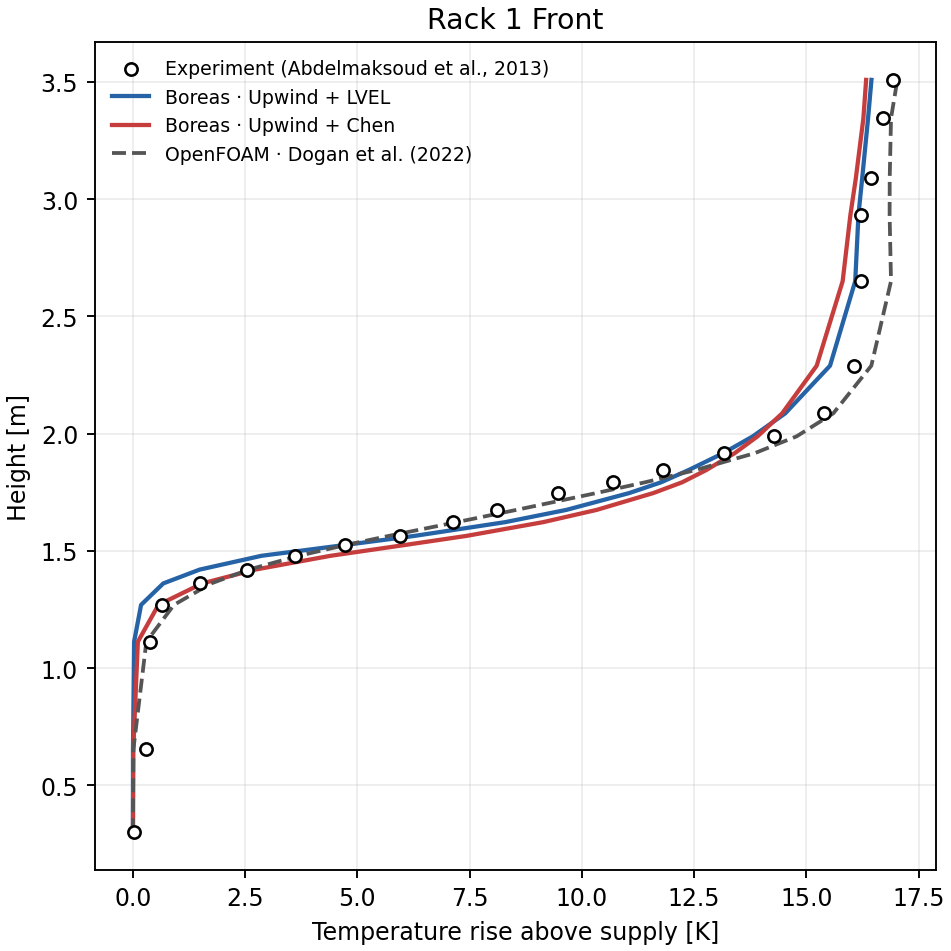
Rack 1 front. The horizontal axis is temperature rise above the 14 °C supply air; the vertical axis is height above the floor.
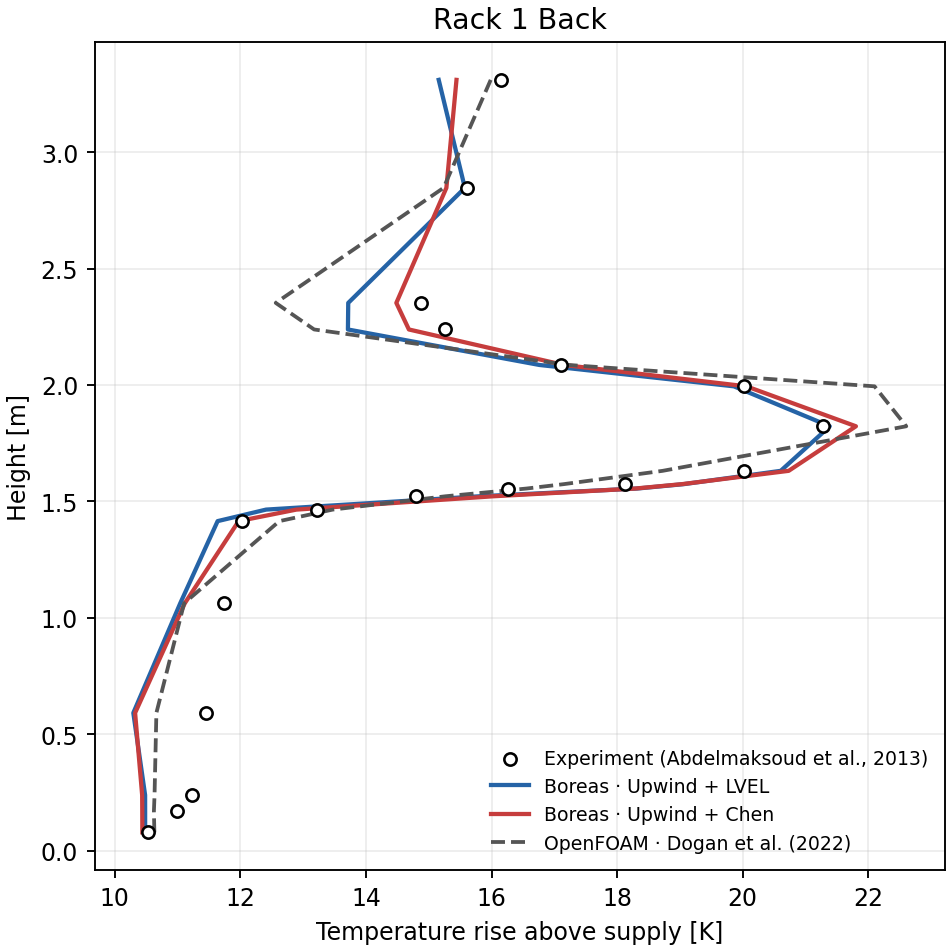
Rack 1 back.
Rack 2
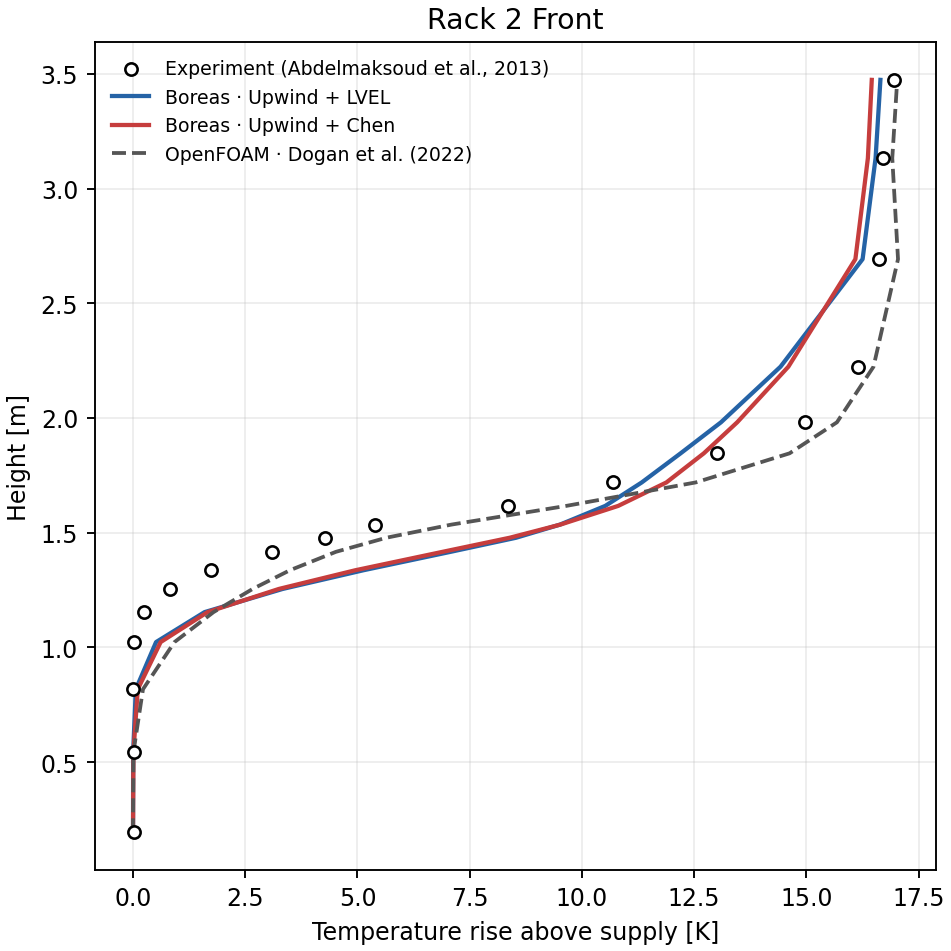
Rack 2 front. Differences between predictions and measurements appear around the middle of the temperature rise region.
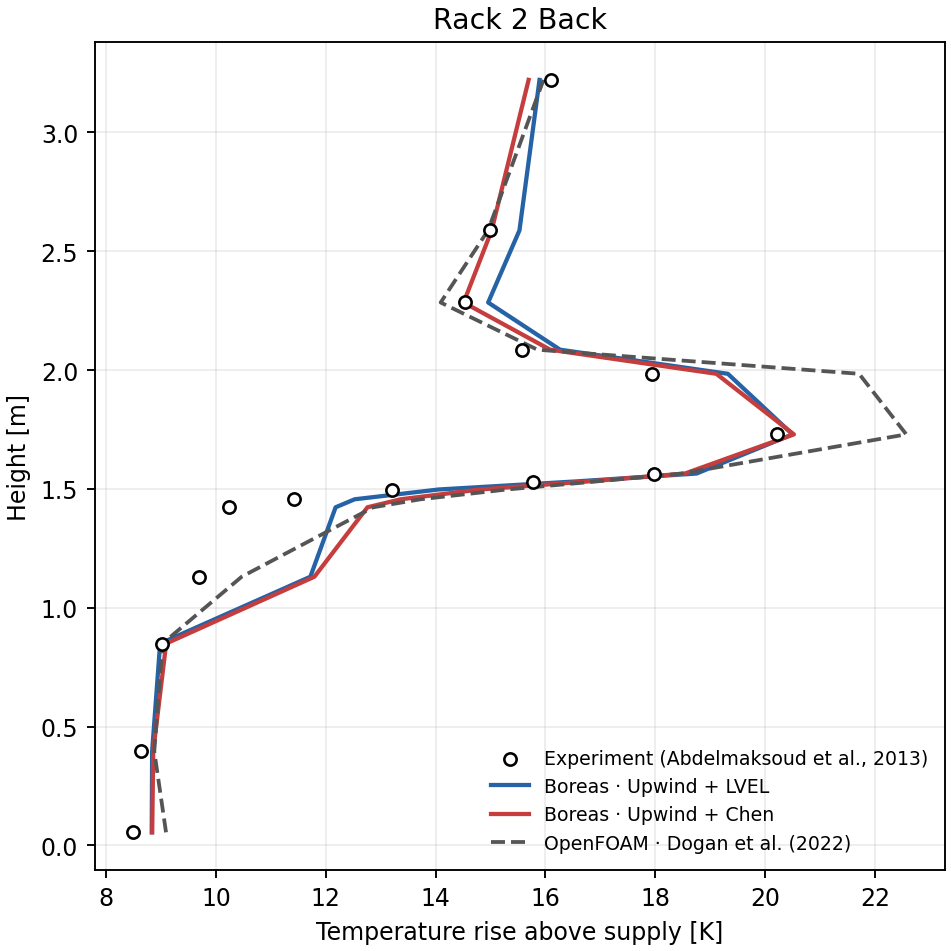
Rack 2 back.
Rack 3
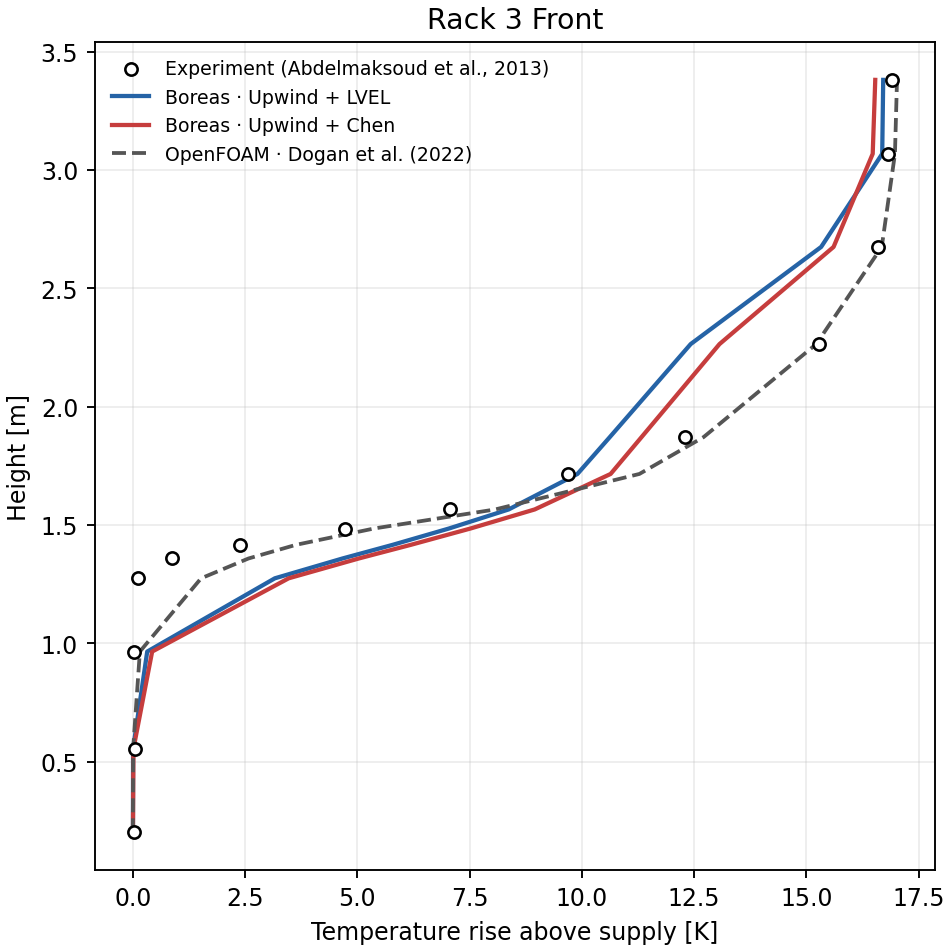
Rack 3 front.
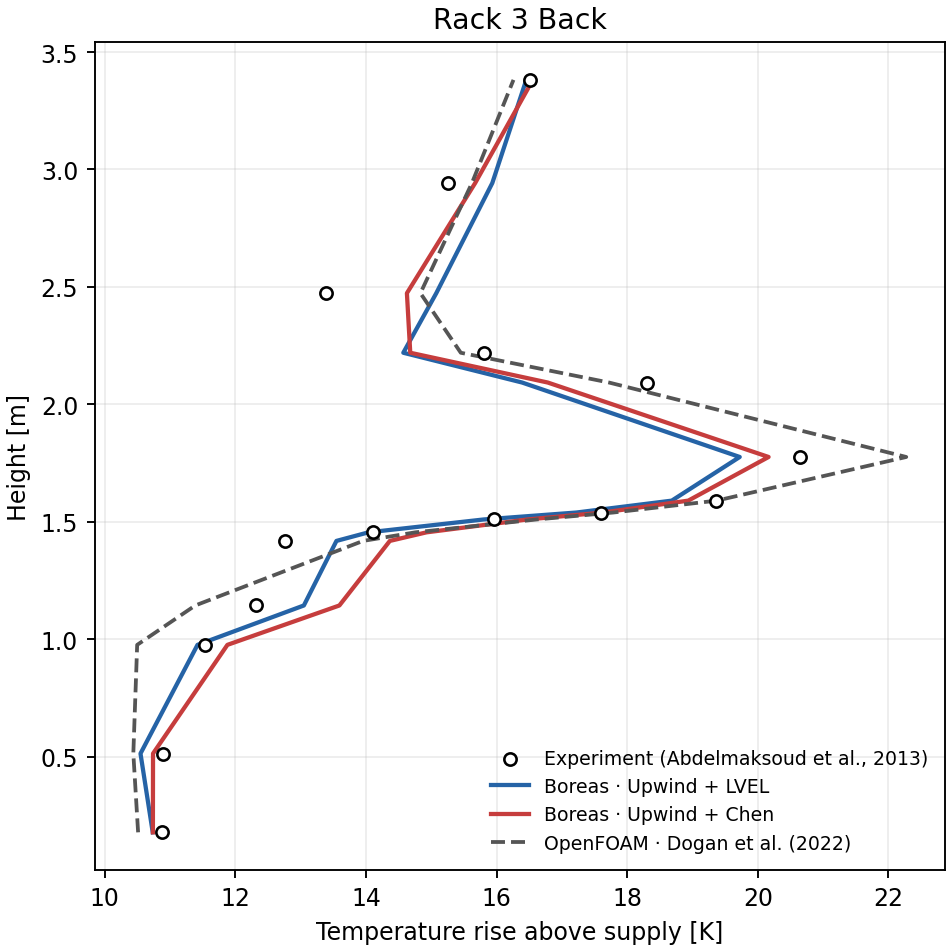
Rack 3 back.
Quantitative results
We use 103 of the 111 experimental measurement points that fall within the height range of Boreas cell centers. Points outside that range are not extrapolated. The OpenFOAM metrics were recalculated at these same 103 measurement points. Error is prediction minus measurement.
| Data | Points | Mean absolute error (MAE) | RMSE | Mean error | R² |
|---|---|---|---|---|---|
| Boreas · upwind + LVEL | 103 | 0.94 K | 1.36 K | +0.29 K | 0.953 |
| Boreas · upwind + chen | 103 | 0.99 K | 1.42 K | +0.52 K | 0.948 |
| OpenFOAM · Dogan et al. (2022) | 103 | 0.74 K | 1.03 K | +0.45 K | 0.973 |
Among the six Boreas advection and turbulence combinations tested for this case, upwind + LVEL has the lowest overall MAE. Agreement varies by measurement location: Boreas chen has a lower MAE than OpenFOAM at Rack 1 back (0.62 versus 0.82 K), and Boreas LVEL does at Rack 2 back (0.77 versus 1.16 K). Larger differences from the experiment remain at the fronts of Racks 2 and 3. The flow-weighted temperature rise across each rack agrees with the values calculated from heat output and airflow: approximately 9.95, 8.64, and 9.87 K.
The OpenFOAM curves are published reference data, not results rerun for this study. Boreas and OpenFOAM use different meshes, rack and supply models, boundary conditions, and numerical implementations. Differences in the table should therefore not be interpreted as a solver ranking under identical conditions.
References
- Abdelmaksoud, W. A., Dang, T. Q., Khalifa, H. E., and Schmidt, R. R. (2013). “Improved Computational Fluid Dynamics Model for Open-Aisle Air-Cooled Data Center Simulations.” Journal of Electronic Packaging, 135(3), 030901. DOI: 10.1115/1.4024766.
- Dogan, A., Yilmaz, S., Kuzay, M., and Demirel, E. (2022). “Development and validation of an open-source CFD model for the efficiency assessment of data centers.” Open Research Europe, 2:41. DOI: 10.12688/openreseurope.14579.1.