
Overview
When laying out a data center (IDC) floor, you often need to compare many alternatives while varying parameters such as rack layout and supply air rate. General-purpose CFD is accurate, but the long per-case runtime makes it impractical to run enough alternatives. Boreas is built for this screening stage — it simplifies the mesh and numerics so a single layout can be solved in minutes to tens of minutes.
In practice, this typically plays out in two stages:
- Layout / airflow screening — quickly compare many cases while varying rack layout and supply air conditions, narrowing down to a promising layout.
- Verification analysis of the finalized layout — run a precise verification analysis (commercial or open-source CFD) on the narrowed-down layout.
This document is an example of stage 1: a steady-state cooling airflow analysis of an 800-rack virtual data center room, computed with Boreas.
Model
- Rack layout: 40 rows x 20 racks = 800 racks (cold aisle / hot aisle arrangement)
- Total heat load: 5 MW
- Supply air: 440.0 m3/s total (0.925926 m/s per floor tile)
This is not based on an actual building floor plan. It's a simplified demo geometry made by repeating a single rack row, with no architectural constraints such as column spacing or a real room shape. The purpose is to show that compute speed stays practical even at an 800-rack, 5MW scale.
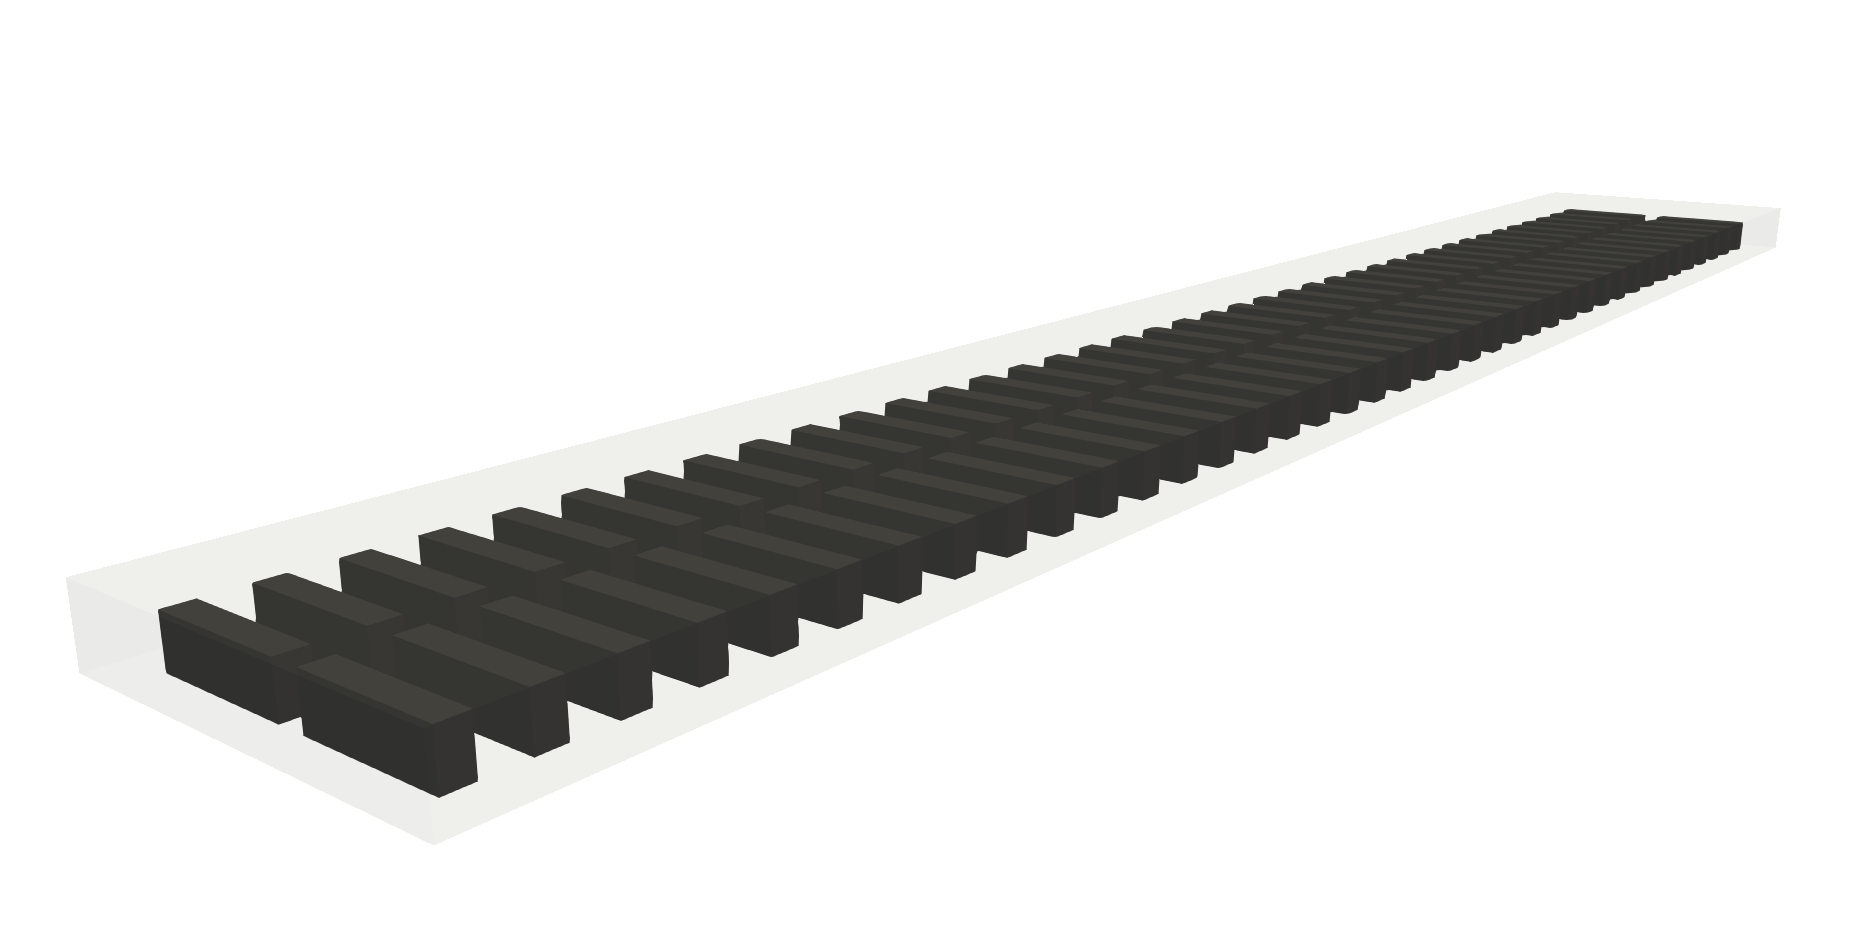
Full geometry — 40 rows x 20 racks, 800 racks total
Steady-State Temperature Distribution
Steady-state temperature distribution across the whole room. Cold aisles (supply side, low temperature) and hot aisles (exhaust side, high temperature) alternate between rows of racks.
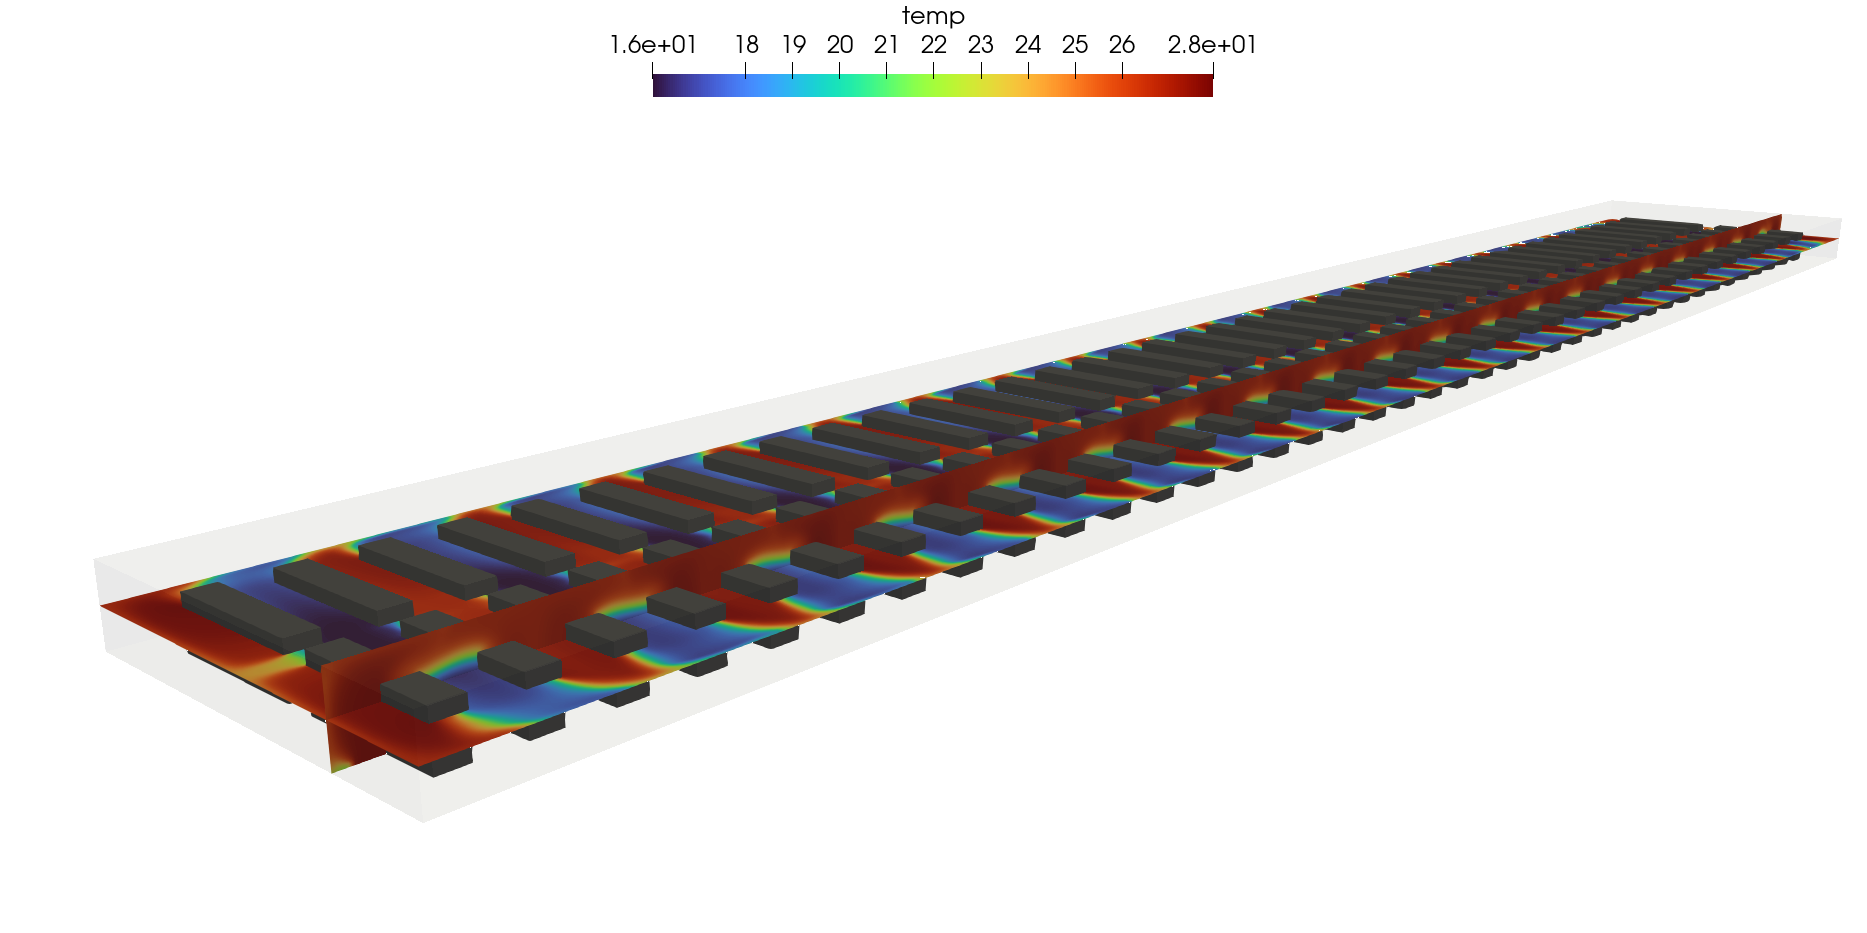
Temperature range 16-28°C — blue (cold aisle) and red (hot aisle) alternate
Zooming into the space between rack rows shows the temperature gradient at the cold-aisle/hot-aisle boundary more quantitatively.
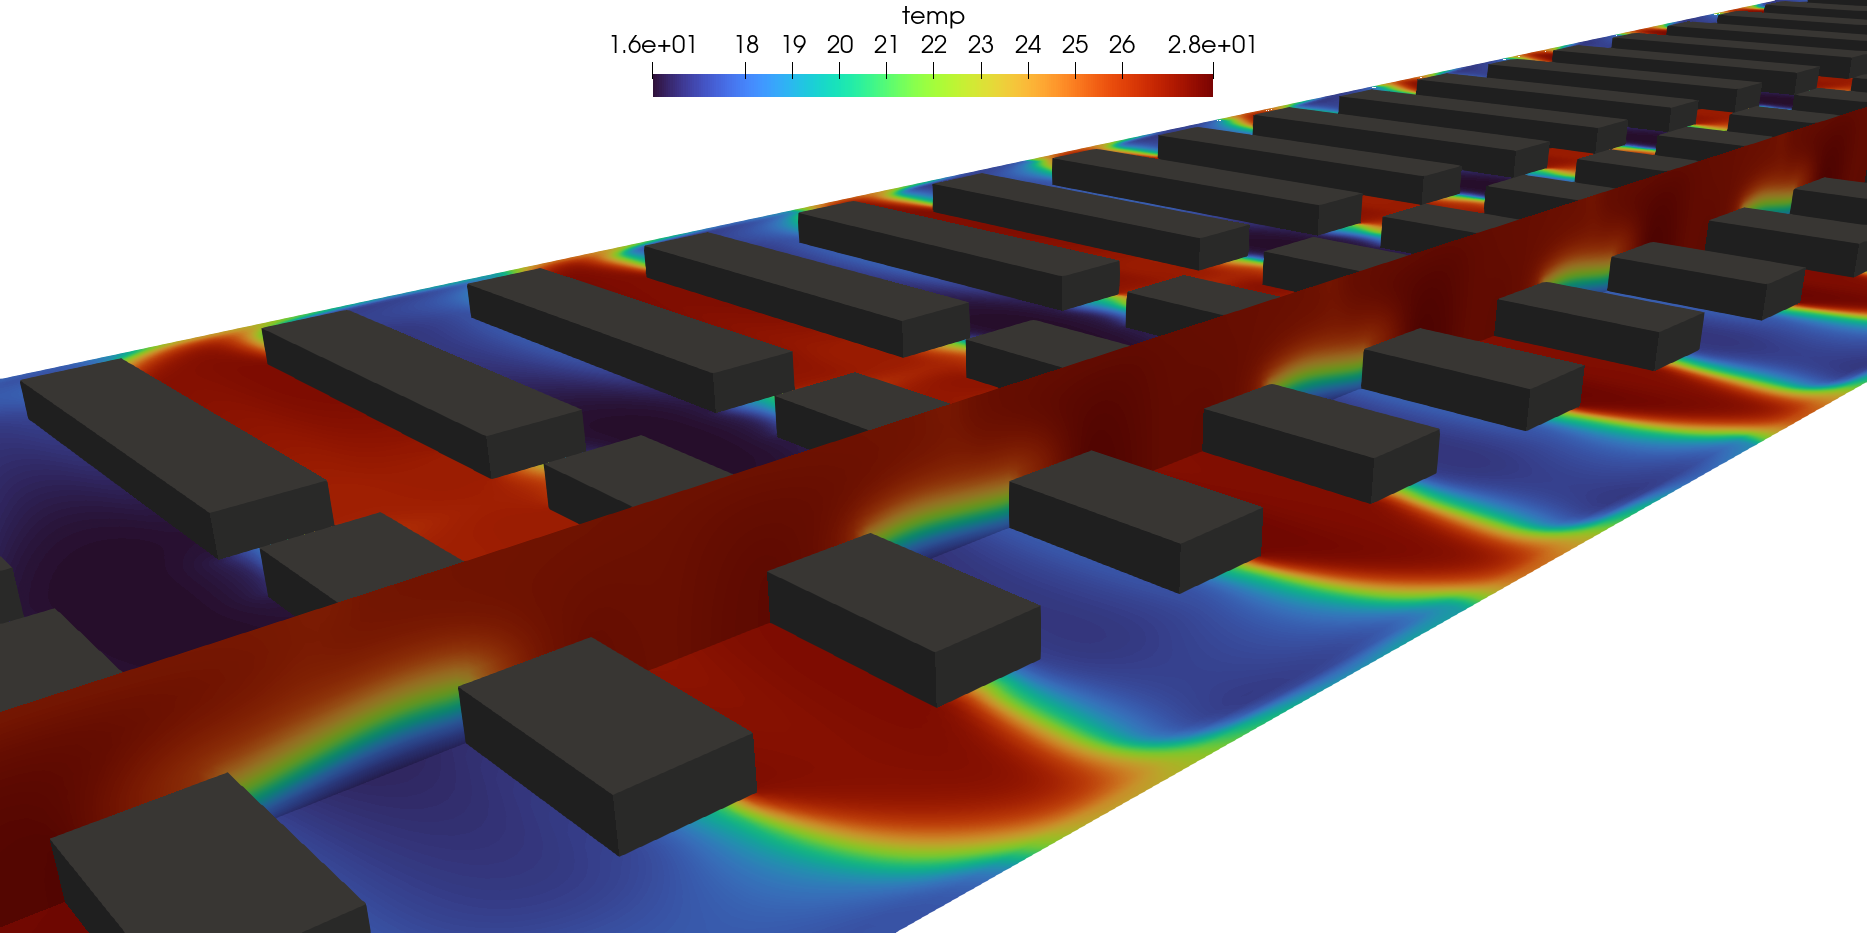
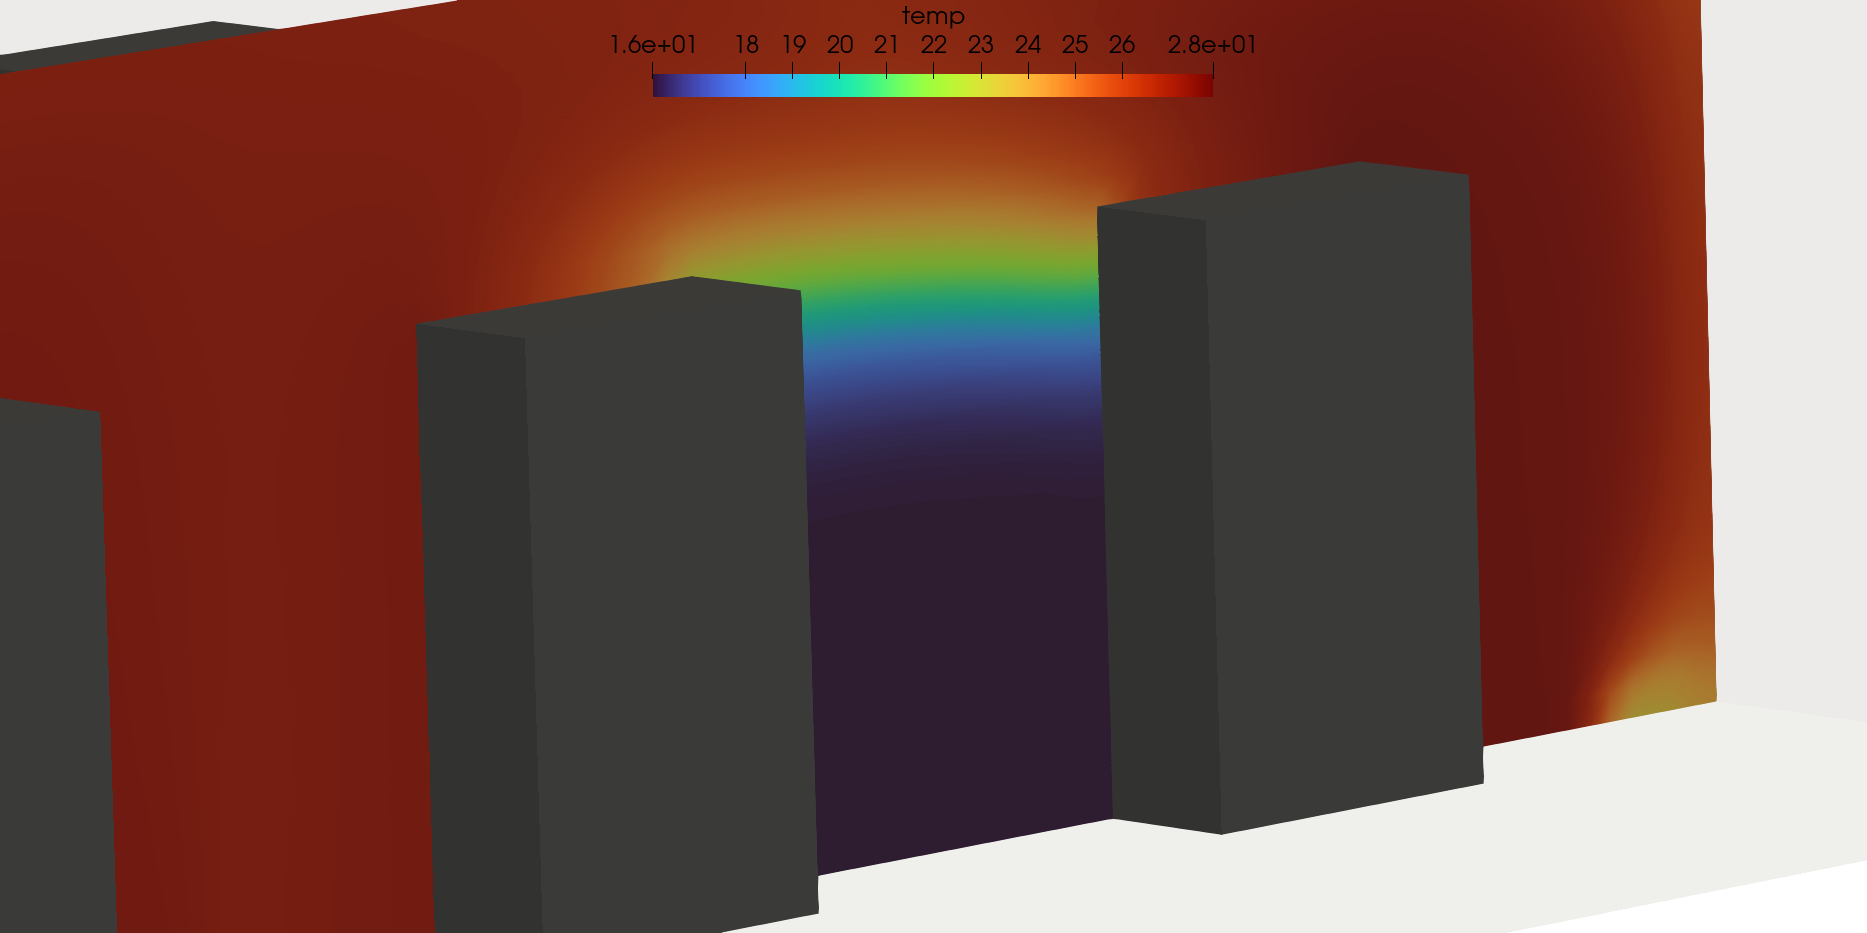
Compute time was about 10-15 minutes on a consumer-grade GPU and about 2 hours on an 8-core CPU — fast enough to compare many alternatives during design screening.
Quantitative Results — Rack Inlet/Exhaust Temperature
Inlet (t_in) and exhaust (t_ex) temperatures for the front 12 of the 800 racks (R1-R12), aggregated at steady state.
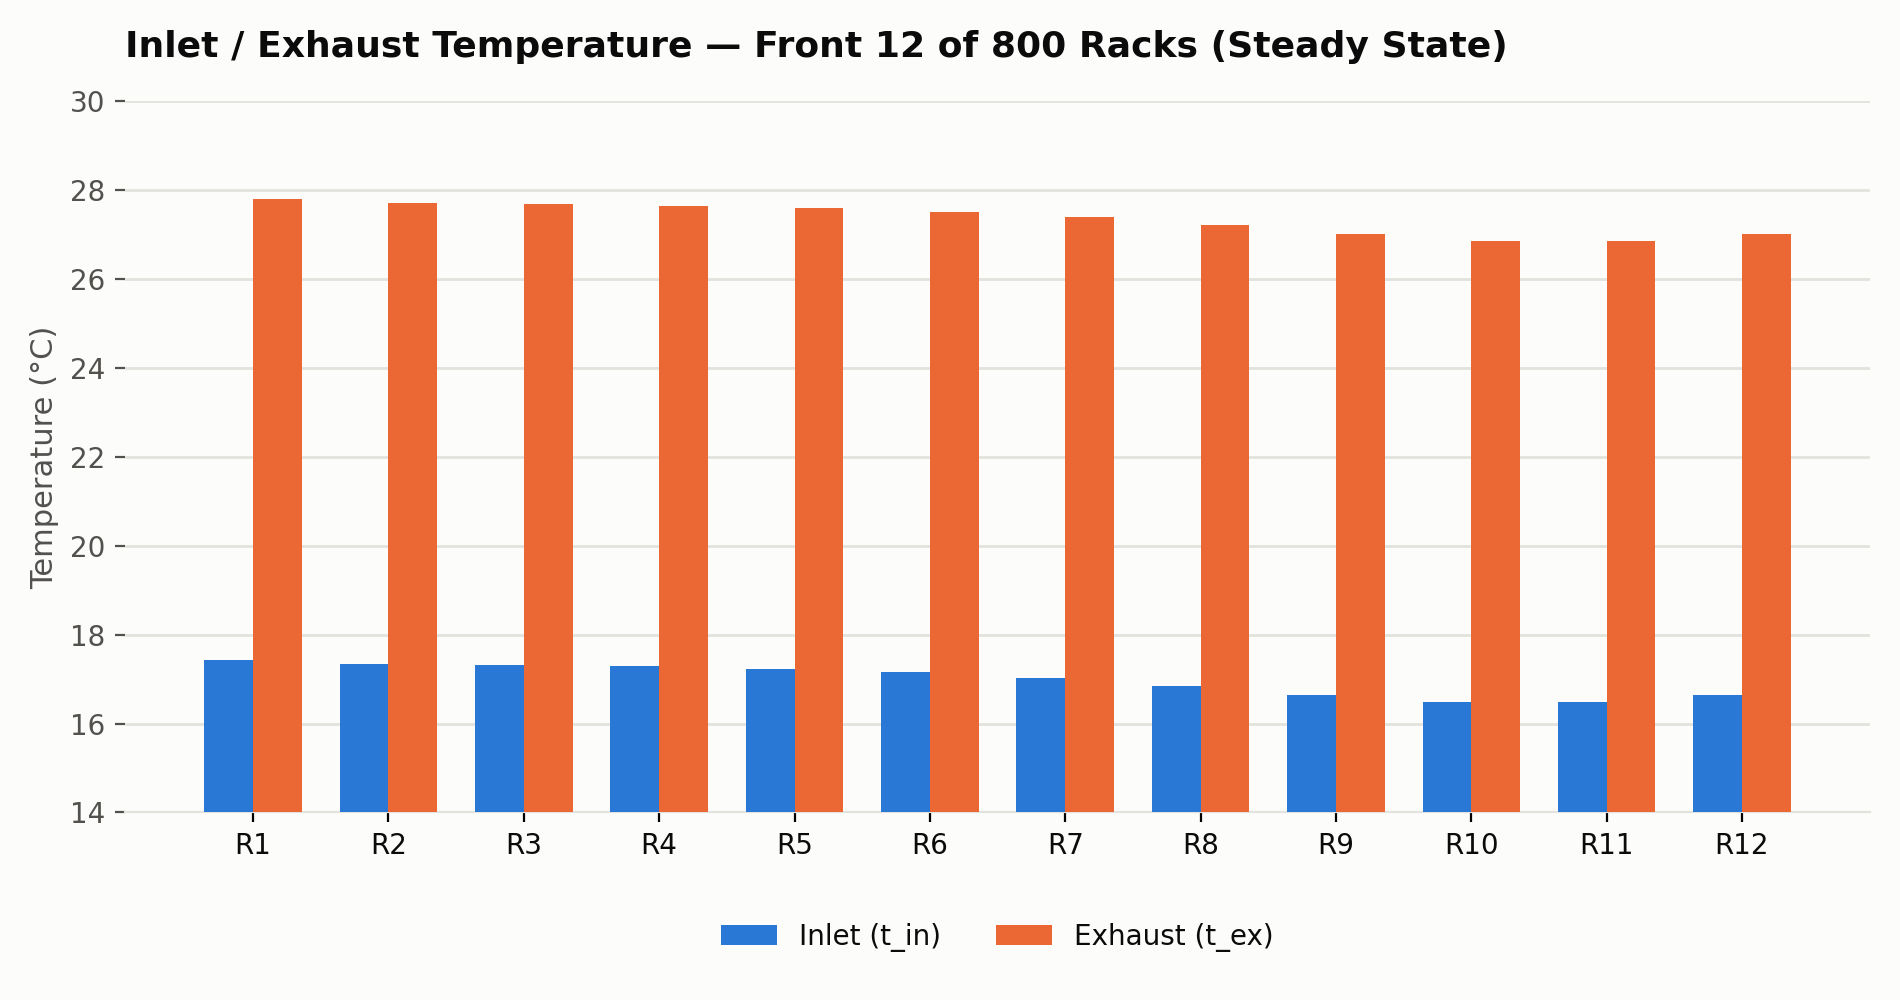
Inlet temperature (blue) stays even across racks, and the rise to exhaust temperature (orange) is likewise uniform
| Item | Value |
|---|---|
| Front-row rack inlet temperature | 16.5 - 17.4°C |
| Front-row rack exhaust temperature | 26.9 - 27.8°C |
| Temperature rise across rack (ΔT) | approx. 10.4°C |
| Hotspot racks (over threshold) | 0 |
Inlet temperature stays within the target range across all 12 racks, and the temperature rise across each rack is uniform with no significant rack-to-rack deviation — no local hotspot racks occurred under this layout and supply air condition.
Local Flow Field — Cold Aisle Supply Flow
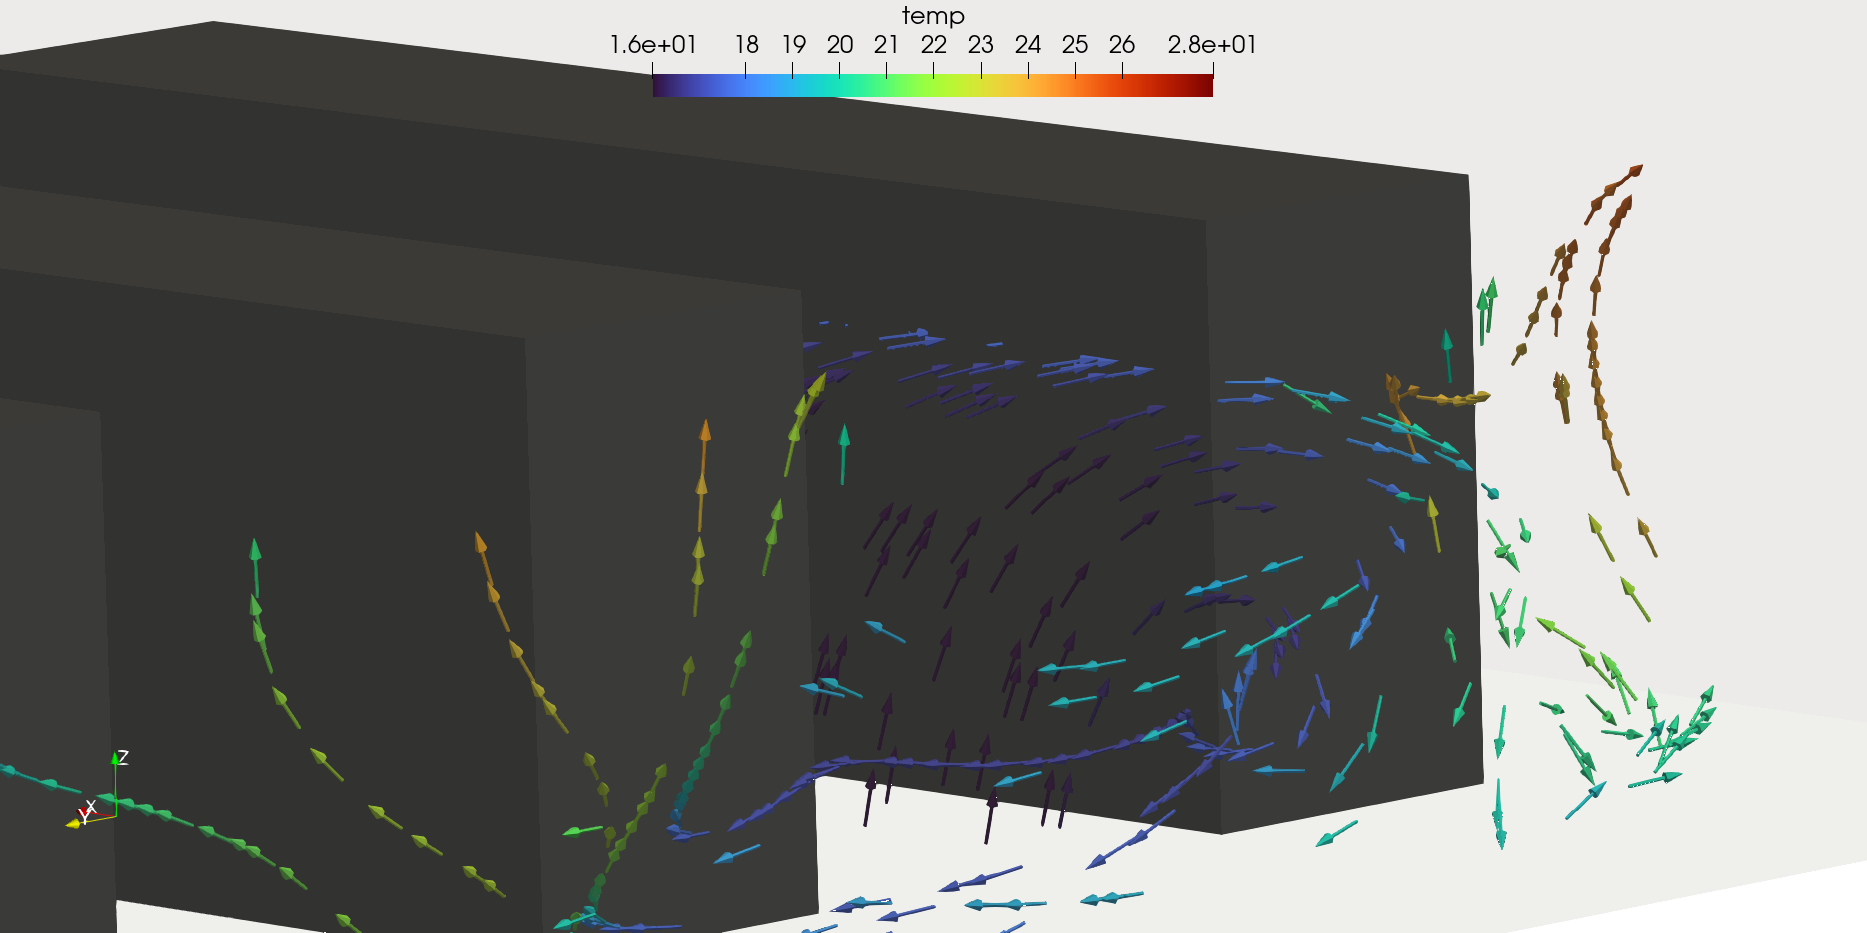
Streamlines and velocity vectors show supply air rising from the cold-aisle floor tiles and curving into the rack inlet face.
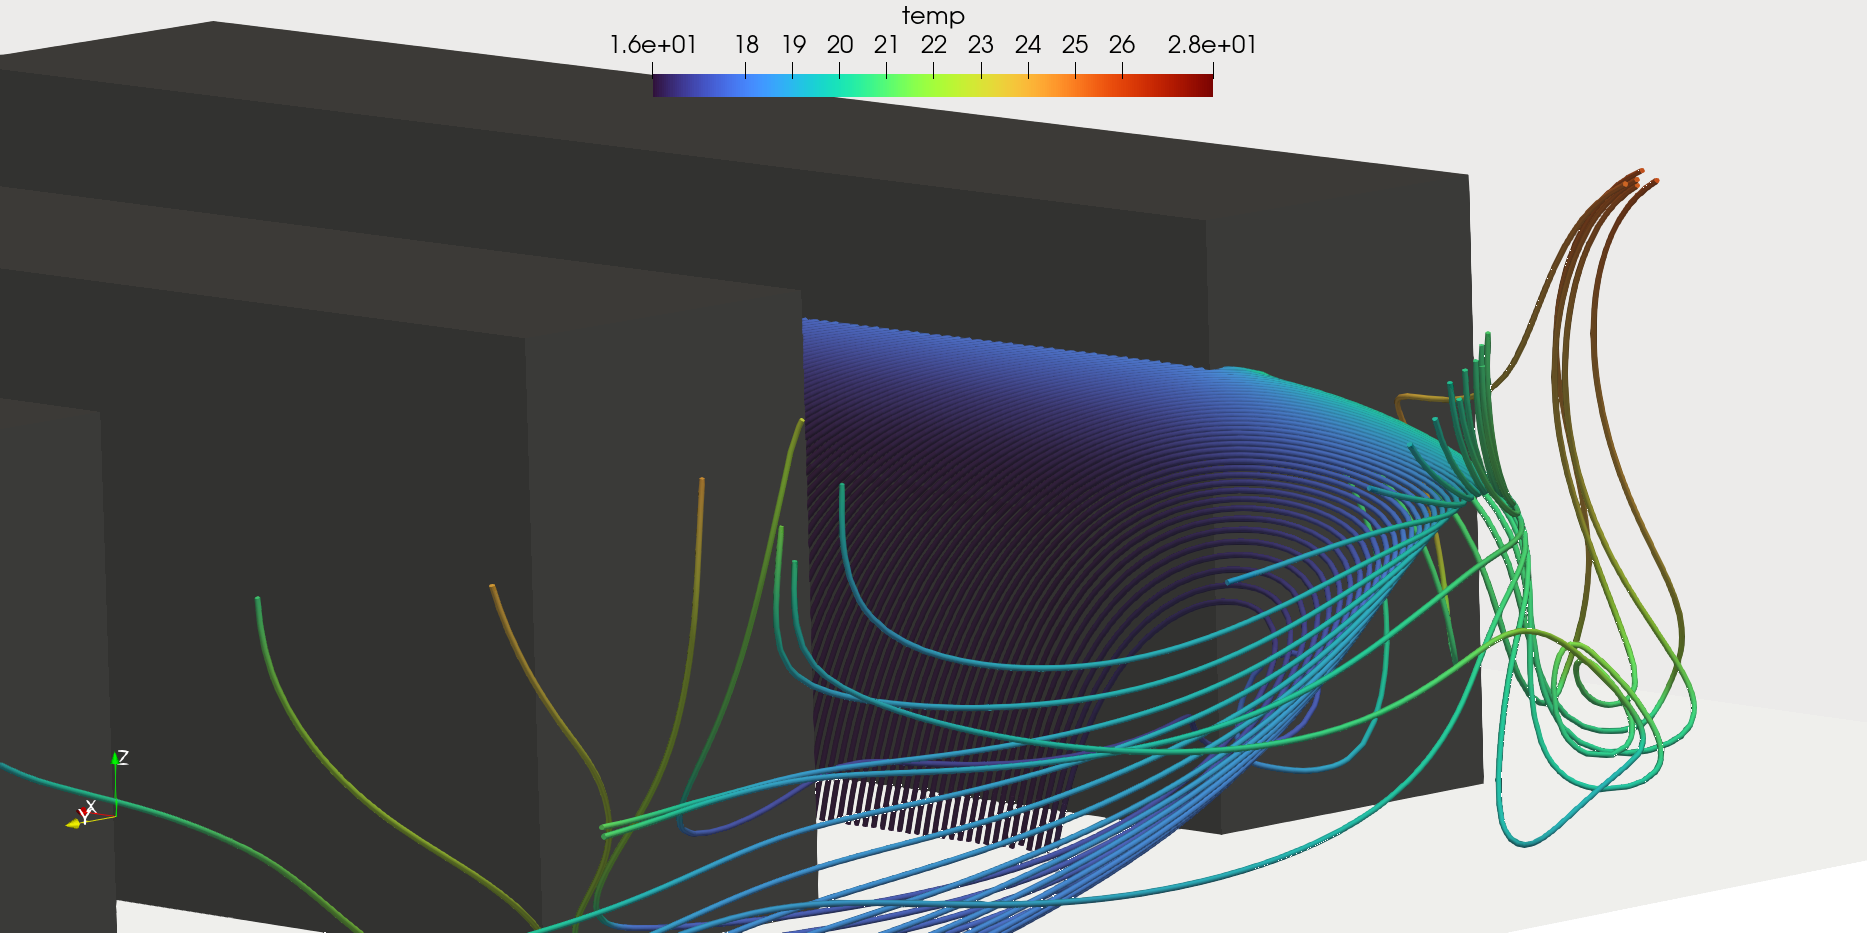
Cold (blue) supply air rises from the tile and enters the rack inlet face; hot (orange/red) exhaust air leaves through the rack into the hot aisle
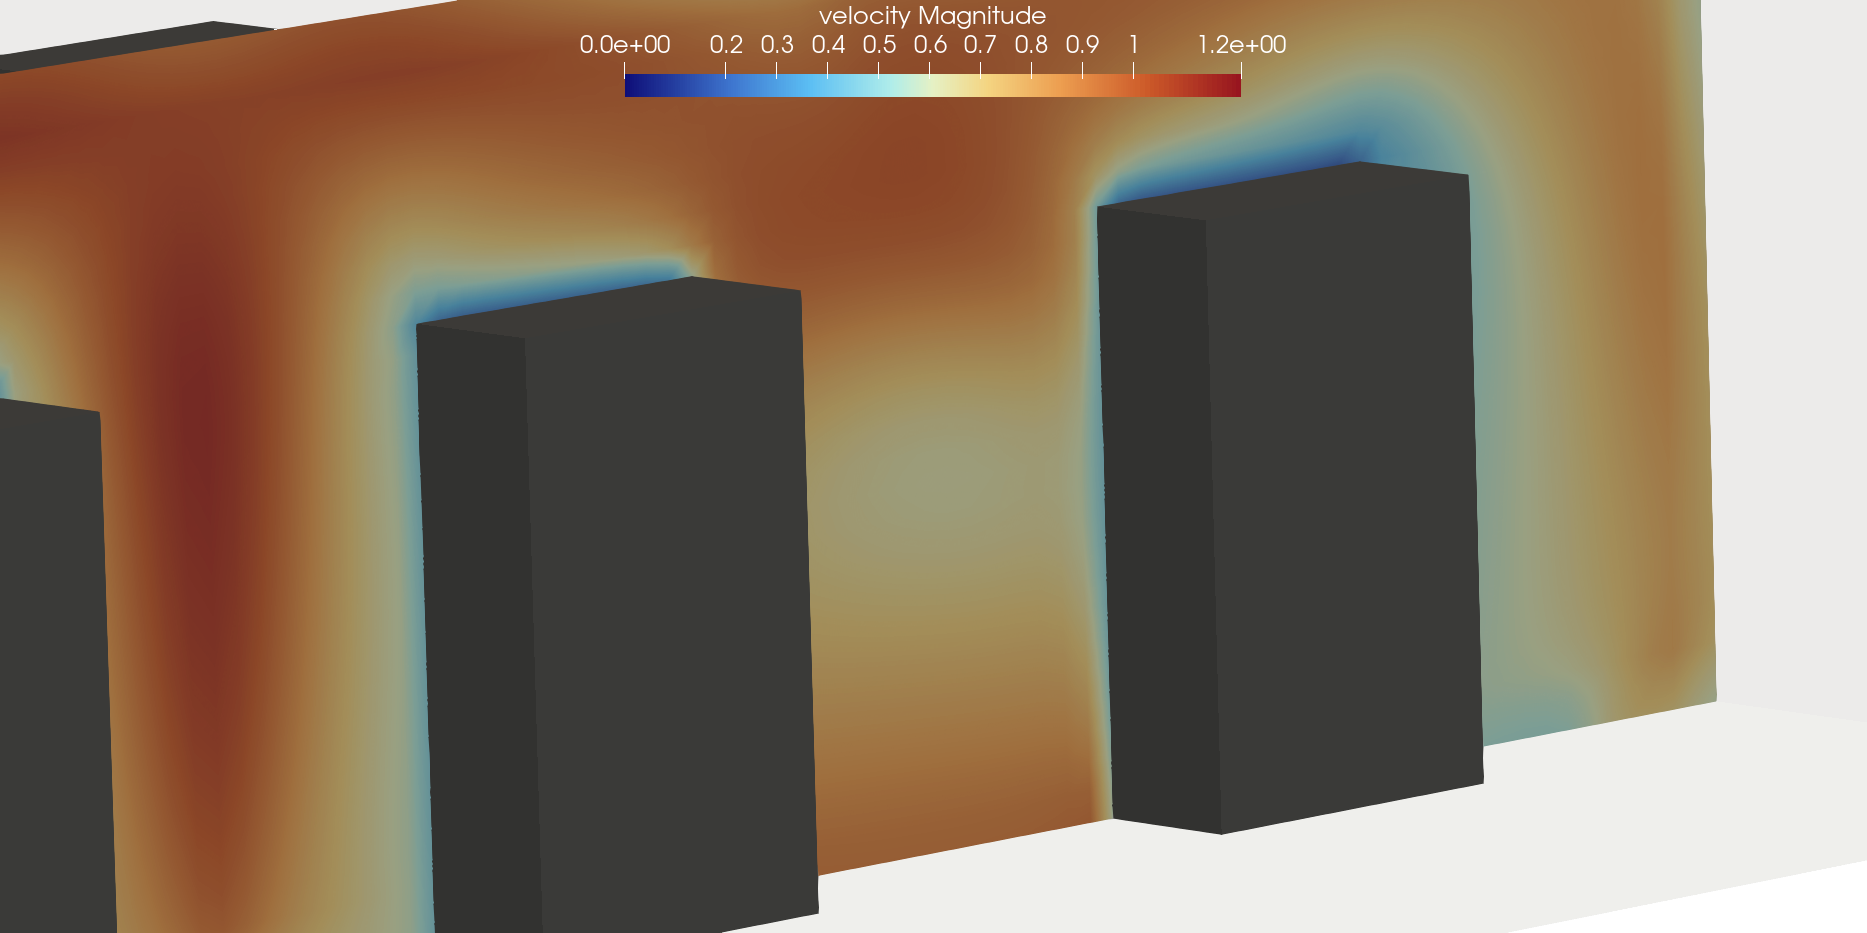
Velocity magnitude on the same cross-section. Velocity is highest directly above the supply tile and in the narrow gap between racks, while the center of the cold aisle is a relatively stagnant region.
Summary
This example shows the kind of output Boreas produces when used for data center cooling airflow screening.
- Quantitative visualization of temperature and airflow distribution across the room
- Identification of local hotspot racks
- Compute speed (about 10-15 minutes per case) fast enough to compare alternative rack layouts and supply air conditions
- Extraction of rack-level inlet/exhaust temperature and temperature rise (ΔT) as quantitative data for reporting
In an actual project, the layout narrowed down through this screening stage is then re-verified with a higher-fidelity CFD analysis as the second stage of the workflow.